
In this article we will discuss about:- 1. Meaning of CVP Analysis 2. Procedure of CVP Analysis 3. Practical Applications of CVP Analysis 4. Assumptions of CVP Analysis 5. Profit-Volume Chart 6. CVP Analysis with Change in Selling Price 7. CVP Analysis in Multi-Product Situations.
Meaning of CVP Analysis:
Cost-Volume-Profit (CVP) analysis studies the relationship between expenses (costs), revenue (sales) and net income (net profit). The aim is to establish what will happen to financial results if a specified level of activity or volume fluctuates, i.e., the implications of levels of changes in costs, volume of sales or prices on profit.
The CVP analysis is the study of the interrelationships of cost behaviour patterns, levels of activity and the profit that results from each alternative combination. In decision making, management pays a great deal of attention to the profit opportunities of alternative courses of action.
The price of a product depends upon so many external and internal factors such as market demand, competitive conditions of the market, management’s marketing policies etc. Cost of the product is influenced by numerous factors such as volume, product mix, price of inputs, size of lot or order, size of plant, efficiency in production and marketing, accounting methods etc.
ADVERTISEMENTS:
The alternatives that involve changes in the level of business activity profit do not usually vary in direct proportion to these changes in volume. This is as a result of the cost behaviour patterns. It is an analytical tool in studying the interrelationship between volume, cost and prices and profits and helps in determining sales volume to achieve a level of profit and to assess the most profitable combination of volume and costs.
This technique is used by the management in planning and decision making process to maximize the profits of the company. The basic assumption in making CVP analysis is that fixed cost in total remains constant, variable cost per unit remains constant, selling price per unit does not change with volume.
In real world situation, all of them keep on changing, but still CVP analysis considered the more useful technique in management decision making. CVP analysis is used to determine the minimum sales volume to avoid losses (BEP) and the sales volume required to achieve the profit goal of the firm. It is an important tool for short-run decisions about costs, volume, profit, selling prices for profit planning and to set the desired activity level of the firm.
The CVP analysis can be done through the flexible budgeting. Better evaluation can be made of profit opportunities by studying the relationships among costs, volume and profits. Profit is clearly a function of sales volume, selling prices and costs. The non-uniform response of certain costs to changes in the volume of business can have a serious impact upon profit.
ADVERTISEMENTS:
CVP analysis answers the key question: ‘What effect would increase or decrease in one or more of labour cost, material cost, fixed costs, volume of sales have on profits ?’ CVP analysis is used in profit planning and as a guide to making tactical decisions on sales effort and prices.
Procedure of CVP Analysis:
CVP analysis combines the concepts and techniques listed above by initially following the procedure given below:
(a) Establishing the fixed and variable costs related to products.
(b) Calculating the relationship between sales volume and revenue by reference to actual or assumed unit prices.
ADVERTISEMENTS:
(c) Working out the Prof it-Volume (P/V) ratio by calculating contribution (sales revenue minus variable cost) as a proportion of sales revenue.
(d) Using differential costing and sensitivity analysis to assess the impact of alternative decisions on activity levels on costs and profits.
(e) Drawing up break-even charts which establish the point at which sales begin to produce profits.
(f) Deducing from the break-even analysis, the margin of safety ratio to indicate the levels of profit at different volumes of sales above the break-even point.
ADVERTISEMENTS:
(g) Determining the cumulative or combined effect of each product on profitability to assess the effects of changes in the product mix.
The outcomes of each of the above analysis are then linked to answer such questions as follows:
(a) What sales revenue must be achieved to recover fixed costs?
(b) By what percentage can current sales drop before the margin of safety is exhausted and break-even point is reached?
ADVERTISEMENTS:
(c) How will profits be affected by different levels of sales?
(d) What level of sales revenue must be achieved to reach profit targets?
(e) What are the implications of increase or decrease in costs per unit or fixed costs on profits?
(f) What is the optimum mix of products from the point of view of probability?
ADVERTISEMENTS:
(g) What effect will price changes have on profits?
The benefit of CVP analysis is that it highlights the key factors that affect profits and enables the company to understand the implications of changes in sales volume, costs or prices. This knowledge of cost behaviour patterns and profit volume relationships provides insights which are valuable in planning and controlling short-run and long-run operations.
Practical Applications of CVP Analysis:
CVP analysis is applied in the following situations:
(a) Planning and forecasting of profit at various levels of activity.
ADVERTISEMENTS:
(b) Useful in developing flexible budgets for cost control purposes.
(c) Helps the management in decision making in the following typical areas:
(i) Identification of the minimum volume of activity that the enterprise must achieve to avoid incurring loss.
(ii) Identification of the minimum volume of activity that the enterprise must achieve to attain its profit objective.
(iii) Provision of an estimate of the probable profit or loss at different levels of activity within the range reasonably expected.
(iv) The provision of data on relevant costs for special decisions relating to pricing, keeping or dropping product lines, accepting or rejecting particular orders, make or buy decision, sales mix planning, altering plant layout, channels of distribution specification, promotional activities etc.
ADVERTISEMENTS:
(d) Guide in fixation of selling price where the volume has a close relationship with the price level.
(e) Evaluates the impact of cost factors on profit.
Cost-volume-profit analysis of multiple products may be extended to linear programming problem of short-term capacity utilization where a number of products are involved may be conveniently formulated into linear programming models.
Assumptions of CVP Analysis:
The CVP analysis is subject to the following assumptions:
(a) It assumes that output is the only factor affecting costs, but there are other variables which can affect costs, e.g., inflation, efficiency and economic and political factors.
(b) Not all costs can be easily and accurately separated into fixed and variable elements.
(c) Total fixed costs do not remain constant beyond certain ranges of activity levels but increase in a step-like fashion.
(d) It assumes that where a firm sells more than one product the sales mix is constant. However, the sales mix will be continually changing owing to changes in demand.
(e) There is an assumption that there are either no stocks, or no changes in stock levels. Profit is therefore dependent on the sales volume. However, when changes in stock levels occur and such stocks are valued using absorption costing principles, then profit will vary with both production and sales.
(f) CVP analysis assumes that costs and sales can be predicted with certainty. However, these variables are uncertain and the Finance manager must try to incorporate the effects of uncertainty into his information.
Profit-Volume Chart:
The impact of cost and revenue on profit at various levels of activity can be represented in profit volume chart which highlights the loss area at the levels of activity below the break-even volume and the profit area at levels of activity above the break-even volume.
Profit curve cuts the vertical axis below the point at zero profit even when there are no sales the fixed cost must be paid and, consequently, the area below the break-even volume represents loss.
The profit-volume chart is shown in figure 19.3 given below:

The following steps are involved in construction of profit-volume chart:
Step 1:
Select a scale for sales on horizontal axis.
Step 2:
Select a scale for profit and fixed costs on vertical axis.
Step 3:
The horizontal sales line divides the chart into two parts. The lower part of the line is representing loss area and the area above the line represents the profit area.
Step 4:
On the vertical axis, the area below the sales line represents fixed costs and above that represents profit.
Step 5:
Profit and fixed costs are plotted for corresponding sales volume and the points are joined by a line called ‘profit line’.
Step 6:
The point where the profit line intersects the sales line is the ‘break-even point’.
Step 7:
The angle which the profit line makes with the sales line is called ‘angle of incidence’.
Step 8:
The sales volume beyond the point of intersection is called ‘margin of safety’.
Illustration 1:
PQR Ltd. reports the following results for year ended 31st March, 2009:

Construct a profit-volume graph and also verify the same with the mathematical analysis.
Solution:
![]()
Margin of Safety = Actual sales – B.E. sakes = 2,00,000 – 1,25,000 = Rs 75,000

CVP Analysis with Change in Selling Price:
The effects on the potential profits of contemplated selling price changes can be represented on a profit-volume chart as shown in figure 19.5.

CVP Analysis in Multi-Product Situations:
Where a company manufacturing more than one product of varying profitability, a change in the profitability of one product will lead to change in the profitability of group as a whole.
The profit- volume chart may be used to illustrate the effects of changes in product mix by drawing a product profit path as shown in figure 19.6 or separate profit lines are drawn for each of the assumed profit mixes as shown in figure 19.5 for each individual product.

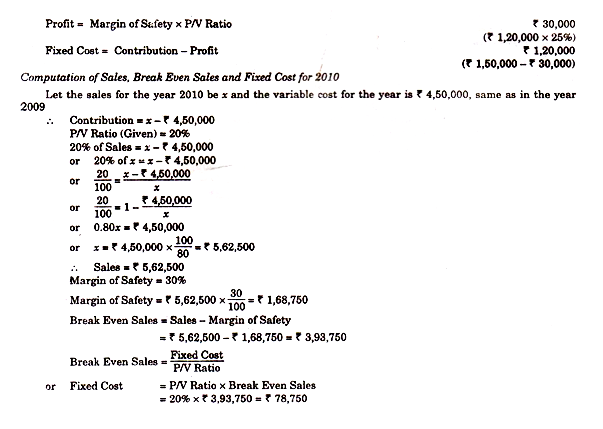
Illustration 2:
ABC Ltd. sells three Products A, B and C. The following information is provided:

Solution:

![]()

