
This article throws light upon the top two types of balance sheet and revenue statements ratios. The types are: 1. Turnover or Velocity Ratios 2. Profitability Ratios.
Type # 1. Turnover or Velocity Ratios:
(a) Stock/Inventory-Turnover Ratio:
This ratio shows the relationship between inventory at close of the business and the overall turnover. In other words, it indicates the number of times the inventory of a firm rotates within an accounting cycle. There are, however, two formulations for ascertaining the Stock-Turnover Ratio, viz.,
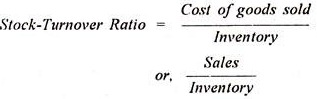
It is suggested that in the calculation of Stock-Turnover Ratio, first, stock should be taken the average figures (Average Stock = [ (Opening Stock + Closing Stock) /2 ] instead of ending stock figure, because, the level of inventory fluctuates over the entire year and if average inventory figure is taken, it helps to an extent in smoothing out the fluctuation.
ADVERTISEMENTS:
The application of the formula, Sales/Inventory, it is suggested, is to be made by a financial analyst only where the figure of cost of goods sold is not available in the published annual statements. The normal of this ratio may be taken as 5 to 6 times.
(b) Debtors’ Turnover Ratio:
It indicates the number of times on the average that Debtors turnover each year. There are two approaches for calculation of Debtors’ Turnover Ratio.
ADVERTISEMENTS:
The first of them is:

Generally, a high turnover ratio is considered congenial for the business as it implies better cash flow. In the absence of information relation to credit sales and opening and closing balances of Debtors, the Debtors’ Turnover Ratio is calculated by dividing total sales figure by closing balance of Debtors.
The second one lies in the determination of the average collection period ratio, It is computed by dividing the days in a year by Debtors Turnover, that is,
ADVERTISEMENTS:
Debtors, Turnover Ratio = (Debtors/ Credit Sales) x 365
Normally, the shorter the average collection period the better is the quality of Debtors, since short collection period implies the prompt payment by Debtors. 45 to 65 days may be considered as normal.
(c) Creditors’ Turnover Ratio:
It indicates the number of times on the average that the Creditors turnover each year. There are two approaches for the calculation of Creditors’ Turnover Ratio. One of them is:
ADVERTISEMENTS:
Creditors’ Turnover Ratio = Credit Purchases/ Average Creditors

Unless it is caused by inability of the firm to pay Creditors, normally, the lower the Creditors’ Turnover Ratio, the more it is congenial for the firm to ensure its liquidity and solvency. In the absence of detailed information regarding credit purchases, opening and closing balances of Creditors, this ratio is calculated by dividing total purchases figure by closing balance of Creditors.
The other approach is the determination of the average payment period. This is computed by dividing the days in a year by Creditors turnover, that is,
![]()
Normally, the longer the credit period allowed by Creditors, the greater will be the advantages to the firm from the standpoint of its liquidity and solvency. 60 to 90 days may be considered as normal.
(d) Turnover to Assets and Liabilities:
i. Turnover to Fixed Assets Ratio:
It is computed by dividing total sales (or cost of sales) by fixed assets. It indicates whether there was adequate investment in Fixed Assets or over-investment or under-investment in fixed assets. This ratio is an index to the efficiency of the management.
![]()
ii. Turnover to Current Assets Ratio/Working Capital Ratio:
It indicates whether the investments in current assets or net current assets (i.e.. working capital) have been properly utilised. It is computed by dividing total sales by Total Current Assets/Net Current Assets.
![]()
iii. Turnover to Total Assets:
ADVERTISEMENTS:
This is the ratio between Sales and Total Assets and it shows whether or not the total assets have been properly utilised and measures the effective use of capital. The higher the ratio, the greater will be the return but too high a ratio will mean overtrading.
![]()
iv. Turnover to Current Liabilities Ratio:
It is calculated by dividing the Turnover/Sales by Current Liabilities.
![]()
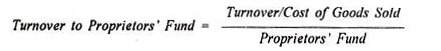
v. Turnover to Proprietors’ Fund Ratio:
ADVERTISEMENTS:
It is computed by dividing the Cost of Goods Sold/Turnover by the Proprietors’ Fund or Owned Capital. It indicates whether or not the proprietors’ fund has been properly managed, i.e., whether there is any under capitalisation or over-capitalization.
Type # 2. Profitability Ratios:
(a) Return on Capital Employed (ROCE):
This is the ratio of Net Profit (after Tax) to Capital Employed. It shows whether the amount of capital employed has been effectively used or not. It is an index to the operational efficiency of the business as well as an indicator of profitability. Therefore, the higher the ratio, the more efficient use of the capital employed, the better is the management efficiency and profitability.
Moreover, the capital employed basis provides a test of profitability related to the sources of long-term funds. And, needless to mention here, that a proper comparison of this ratio with similar firms, with the industry average and over the time would provide sufficient insight into how effectively and efficiently the long-term funds of creditors and owners are used.
The ROCE can be computed in different ways as under:

(b) Return on Proprietors’ Fund/Earnings Ratio:
It is the ratio of Net Profit (after tax) to Proprietors’ Fund. It reveals the rate of the earning capacity of the business. That is why it is alternatively called Earning Ratio. It also indicates whether the proprietors’ fund has been used properly or not. The higher the ratio, the greater will be the return for the owners and the better the profitability.
Return on Proprietors’ Fund = Net Profit (after Tax) / Proprietors’ Fund
(c) Return on Ordinary Shareholders’ Equity:
This is calculated by dividing the Net Profit (after Tax and Pref. Dividend) by the Shareholders’ Equity (less Pref. Share Capital). This ratio is applied for testing profitability. The higher the ratio, the better is the return for the ordinary shareholders.
Return on Ordinary Shareholders’ Equity = Net Profit (after Tax and Pref. Dividend) / Proprietors’ Equity (less Pref. Share Capital)
(d) Net Profit to Fixed Assets Ratio:
This is the ratio of Net Profit to Fixed Assets which indicates whether or not the fixed assets have been effectively utilised in the business.
Net Profit to Fixed Assets Ratio = Net Profit / Fixed Assets
(e) Net Profit to Total Assets Ratio:
This is the ratio of Net Profit to Total Assets. It also indicates whether the total assets of the business have been properly used or not. If not properly used, it proves inefficiency on the part of the management. It also helps to measure the profitability of the firm.
Net Profit to Total Assets = Net Profit / Total Assets
(f) Price Earnings Ratio:
It is the ratio which relates to the market price of the shares to earning per equity share. A high ratio satisfies the investors and indicates the share prices that are comparatively lower in relation to recent earning per share. It is highly significant from the point of view of prospective investors.
Price Faming Ratio = Market price of a share (MPS) / Earning per share (EPS)
(g) Earning Price Ratio/Earning Yield:
The yield is expressed in terms of market value per share. This ratio is calculated by dividing Earning per share by the Market Price per share. It is also very useful to prospective investors.
Earning Price Ratio/Earning Yield = Earnings per share / Market price per share
(h) Earning per Share (EPS):
This is calculated by dividing the net profit (after Tax and Pref. Dividend) available to the shareholders by the number of ordinary shares. It indicates the profit available to the ordinary shareholders on a per share basis.
Earning per Share= Net Profit (after Tax and Pref. Dividend) available to Ord. Shareholders/ Number of Ordinary Shares
This ratio should be used carefully as a measure of profitability since it does not recognise the effect of increase in equity capital as a result of retention of earnings.
(i) Dividend Yield Ratio:
It is calculated by dividing the cash dividend per share by the market value per share. It is very important to the new investors.
Dividend Yield Ratio = Dividend per share (DPS) / Market value per share (MVPS)
(j) Dividend Pay-out Ratio/Pay-out Ratio:
It defines the relationship between the returns belonging to the ordinary shareholders and the dividend paid to them, or, the percentage share of Net Profit (after Tax and Pref. Dividend) is paid to ordinary shareholders as dividend.
It can be calculated as under:
Dividend pay-out Ratio = Dividend per Share (DPS) / Earning per Share (EPS)
Or, = Total Dividend to ordinary Shareholders (Cash Dividend) /Total Net Profit available to Ordinary Shareholders
(k) Dividend per Share (DPS):
It is the net distributed profit (Net Profit after Interest and Pref. Dividend) belonging to the shareholders divided by the number of ordinary shares. In other words it reveals the amount of dividend paid to the ordinary shareholders on a per share basis. It cannot be considered as a reliable measure of profitability.
Dividend per share = Dividend paid to Ordinary Shareholders / Number of Ordinary Shares
Illustration:
Following is Profit and Loss Account and the Balance Sheet of Sudipta Ltd.

Market price of an equity share is Rs. 5.
Ascertain the following Balance Sheet and Revenue Statement Ratios:
(a) Stock Turnover Ratio;
(b) Debtors’ Turnover Ratio;
(c) Creditors’ Turnover Ratio;
(d) Turnover to Total Assets Ratio;
(e) Turnover to Proprietors’ Fund;
(f) Turnover to Working Capital;
(g) Turnover to Current Assets;
(h) Turnover to Fixed Assets;
(i) Turnover to Current Liabilities;
(j) Return on Capital Employed;
(k) Return on Proprietors’ Fund/Earning Ratio;
(I) Net Profit to Fixed Assets Ratio;
(m) Net profit to Total Assets Ratio;
(n) Earning per Share;
(o) Earning Price/Earning Yield Ratio;
(p) Price- Earning Ratio;
(q) Dividend per share;
(r) Dividend Ratio/Dividend Yield;
(s) Dividend-pay-out Ratio.
Solution:


Du Pont Chart or Pyramid of Ratios:
It has already been discussed earlier that the earning power of a firm is represented by return on investment, (ROI) which again expends on two ratios viz. (i) Net Profit Ratio and (ii) Capital Turnover Ratio.
Needless to mention here that if these two ratios change, there will be a consequent change in ROI since these ratios depend on many factors which may change frequently. The factors which affect the ROI can be represented by a chart what is known as Du Pont chart as it was first introduced by Du Pont Company of U.S.A. in their annual report.
