
After reading this article you will learn about Financial Leverage:- 1. Meaning of Financial Leverage 2. Types of Financial Leverage 3. Degree 4. EBIT-EPS Analysis.
Meaning of Financial Leverage:
Financial leverage may be expressed when the residual net income (earnings after interest and taxes and preference dividend) varies not in proportion with operating profit (EBIT). This leverage reveals the changes in taxable income in comparison with the changes in operation.
In other words, a major part is played by interest on debt financing, debenture interest, preference dividend (i.e., fixed interest bearing securities) in the entire capital structure of the firm.
This leverage actually refers to the mix of debt and equity used to finance the firm’s activities. The firm which uses a lot of debt (in various form) is said to be highly levered In short, when the debt capital (debenture, preference share, long-term financing etc.) is more in comparison with equity capital it is highly levered and in the opposite case, it is said to be low levered.
Types of Financial Leverage:
ADVERTISEMENTS:
Favourable and Unfavourable Financial Leverage:
When the EPS increases as an impact of debt-financing in the corporate capital structure, it is called favourable or positive financial leverage. The same happens only when the return on capital employed is more than the cost of debt-financing.
The following illustration shows the favourable financial leverage:
Illustration:
ADVERTISEMENTS:
The Balance Sheet of the firm X and Y are presented below:

Ascertain the amount EPS for both the firm X and Y.
ADVERTISEMENTS:
Solution:
Favourable Financial Leverage;

From the above, it becomes clear that favourable or positive financial leverage appears in the case of firm Y for which EPS has been increased from Re. 1.00 to Re. 1.60 although the EBIT for both the firms are same.
ADVERTISEMENTS:
The same is happened due to the following:
(i) Firm Y borrowed 50% of its fund by issuing debenture whose cost is lower than its return on capital employed. The most significant point is this, it paid 8% interest on debenture whereas it earned a return of 16%.
(ii) From the illustration presented above, it is found that firm Y issued only 5,000 equity shares of Rs. 10 as compared to 10,000 equity share of Firm A. since firm B raised its funds not only by issuing equity share but also by issuing debt financing As a result, the EBIT for the both the firm changes and so also the change in EPS.
The same was changed from Re. 1 to Rs. 1.60. Thus, a firm can raise its EPS by maximum use of its debt financing in its capital structure.
ADVERTISEMENTS:
Now, the opposite side of the picture can also be pointed out i.e., unfavourable financial leverage Unfavourable financial leverage arises only when the company’s return on capital employed is lower than the cost of debt-financing. In short, unfavourable or negative financial leverage appears when EPS is decreased as a result of using debt-capital. Consider the following illustration.
Illustration:
Take the data contained in the previous illustration and assume that EBIT was Rs. 5,000 in both the cases instead of Rs 20,000.

Thus, from the above illustration we can easily experience an example of negative financial leverage. Because, after using debt-capital in the Capital structure EPs is reduced to Re 0.10 in case of Firm Y as compared to Firm X which had Re. 0.25 without having any debt-capital The only reason here is that the cost of debt capital is higher than the return on capital employed i.e., on equity capital.
Degree of Financial Leverage:
ADVERTISEMENTS:
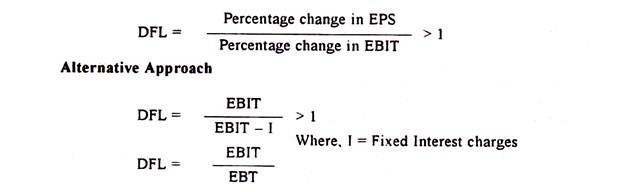
The degree of financial leverage is the percentage change in taxable profit as a result of percentage change in operating profit, i.e., the ability of the firm to utilize fixed financial charges in order to magnify the effect of changes in EBIT on EPS of the firm.
Degree of financial leverage (DFL) is computed as under:
The above equation can better be represented with the help of the following illustration:
ADVERTISEMENTS:
Illustration:

It becomes clear from the above illustration that if EBIT increases by 100% there will be a corresponding increase in EPS by 114%. Thus, DFL shows to what extent a firm can magnify the effect on EPS as a result of a change in EBIT after using fixed financial charges.
Illustration:
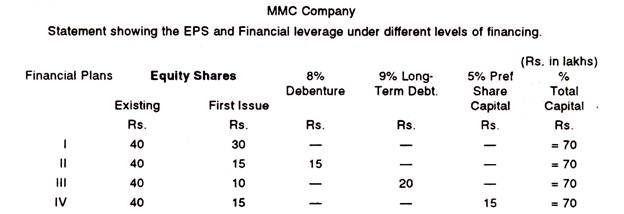
MMC Company has currently an equity share capital of Rs 40 lakhs consisting of 40,000 equity shares of Rs 100 each. The management is planning to raise another Rs. 30 lakhs to finance a major programme of expansion through one of the four possible financing plans.
ADVERTISEMENTS:
The options are:
(i) Entirely through equity issues.
(ii) Rs. 15 lakhs in equity shares of Rs. 100 each and the balance in 8% Debenture.
(iii) Rs 10 lakhs in equity shares of Rs. 100 each and the balance through long-term borrowing at 9% interest p a.
(iv) Rs. 15 lakhs in equity shares of Rs. 100 each and the balance through preference share with 5% dividend.
The company’s expected earnings before interest and taxes (EBIT) will be Rs. 15 lakhs. Assuming corporate tax rate of 50%, you are required to determine the EPS and Comment on the financial leverage that will be authorized under each of the above scheme of financing.
Solution:

Comment:
Since the plans I and IV do not use the technique of debt financing, DFL does not exceed unity. However, out of the remaining two alterations, DFL is higher in case of plan III. As such, plan III should be accepted which is the most profitable debt-equity mix in case of MMC Company.
Trading on Equity:
Sometimes Financial leverage is called ‘Trading on Equity’ This is a device by which the equity shareholders enjoy a large amount of profit at the cost of other fixed interest-bearing securities. The rate of dividend of the equity shares can substantially be increased by the issue of more Debentures and Preference Shares with fixed rates of interest and dividend.
The following example will make the principle clear:
Suppose, the total requirement of capital of a company is Rs. 20, 00,000 and the expected rate of return is 12%. If the entire capital consist of Equity Shares only, there will be no Trading on Equity, but will simply be a return @ 12% on Rs. 20,00,000 by way of dividends.
Now, suppose, the capital structure of the company is as follows:
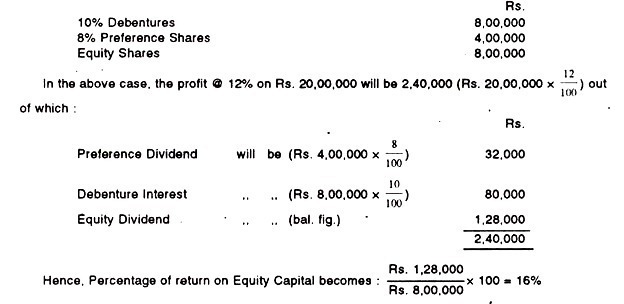
Therefore, by the issue of Debentures and Preference shares, trading on Equity is possible and. as a result, the rate of equity dividend is increased from 12% to 16%.
Note:
Trading on Equity is profitable only when the profit is earned at a higher rate than the rates payable to the holders of Debentures and Preference shares.
EBIT-EPS Analysis:
In order to examine and analyse the effect of financial leverage on the behaviour of EPS:
(a) With various levels of EBIT and
(b) Under alternative financing plans; EBIT- EPS analysis is very useful.
Needless to mention here that when this analysis is applied in order to determine the debt equity mix, the same is given on the value of EPS and at the same time, the alternative which will yield the highest value should be selected as the most profitable financing plan and as such the same is recommended.
As the DFL is the highest at this level no dispute arises between the two viz, EBIT-EPS analysis and financial leverage. For decision making purposes, both of them can be used at the same time.
The effect of EPS with varying levels of EBIT under various sources of financing can better be presented with the help of the following illustration:
Illustration:
Taking the data from the previous illustration, ascertain the effect of EPS under various levels of EBIT using under alternative financing plans.
Assume the EBIT is:

Solution:
Statement showing the EBIT-EPS Analysis for various levels of EBIT under various alternatives financing plan.


The entire picture can be depicted with the help of the following summarised statement relating to EPS- Return on Equity analysis at a glance:

From the above table, when EBIT is expected to be Rs. 3.50 lakhs, Rs. 7 lakhs, Rs. 10.50 lakhs and 14 lakhs, the highest EPS is Rs. 2.50, Rs. 5.27, Rs. 8.70 and Rs. 12.20 in cade of Financial Plans No. I, II, III and IV respectively. Thus, the management must consider the variations in EPS in case of varying levels of EBIT.
The above statement can also be summarised up as under for further information.

From the above summarised table it is formed that if simple average (X̅) is considered. Plan III deems the highest position followed by also the co-efficient of variation which is 56.26% i.e., the greater variability in EPS.
Conclusion:
Equity shareholders will earn maximum benefit from the Financing plan III since it posses relatively high degree of financial leverage.
Computation of EPS and ROE (Return on Equity):
Earnings per share (EPS) is ascertained by dividing net earnings i.e., earnings after interest, taxes and preference dividend by the total number of equity shares.
Thus, EPS is calculated with the help of the following formula:

Needless to mention here that if there is no preference share, P will be omitted from the above. Then the same will be shown as under:
EPS = (I – R) (1 – t)/N
When earning after tax are divided by the net worth or shareholders’ fund (i.e., Equity Share Capital plus Reserve and Surplus), ROE, in that case, will be computed in the following manner:
ROE = (I – R) (1 – t)/N
Where, Z = Net Worth and where there is preference dividend, ROE will take following form:
ROE = (I – R) (1 – t) – P/N
Illustration:
Taking the data from the previous illustration (I.e., MMC Company) calculate EPS and ROE at EBIT level of Rs. 10.50 lakhs and Rs. 14 lakhs for Financing Plants III and IV respectively.
Solution:

![]()
Here, shareholders fund or net worth consists of Equity Share Capital Account only as there were no Reserves and Surplus.
Indifference Point:
The Indifference point arises only at EBIT level at which EPS or ROE are the same regardless of the debt-equity combination i.e., it is the level of EBIT beyond which the benefits of financial leverage start operation relating to EPS. In short, it is that point at which the after tax cost of acquisition of outside funds (viz., debt and preference share) is equal to the rate of return from the investment.
Thus, if the expected EBIT level exceeds the indifference EBIT level, the use of debt financing would be advantageous which will lead to an increase in the EPS. On the other hand, if it is less than the indifference point the benefits of EPS will come out from the equity capital or shareholders’ fund.
Indifference point can also be depicted graphically in the following manner: But before its preparation we are to assume the following data:
Illustration:

Now, we are to calculate the EPS at different Level in the following ways:
EBIT level
(i) At Rs. 5,000:

(ii) EBIT level at Rs. 12,000:
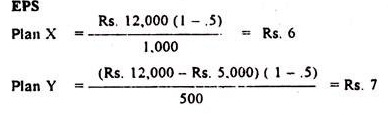

Front the above, we find that OX axis represents EBIT whereas OY axis represents EPS. It is plotted different values of EPS corresponding to Rs. 5,000 and Rs. 12,000 at EBIT levels respectively which are pointed out plan – X and Plan – Y respectively. Needless to mention that the point of intersection is the Indifference Point’ in the graph.
Naturally if a perpendicular is drawn to the X-axis, it revels the EBIT level at Rs. 12,000 corresponding to Y-axis Rs 5 in EPS. Thus, at the said Rs. 12,000 EBIT level with EPS Rs. 5, the firms attains its indifferent point and naturally below this level, financing on equity proves to be more advantageous to the firm.
Method of Computation of Indifference Point:
The indifference point can be computed with the help of the following mathematical approach:

Illustration:
Taking the data from previous illustration, we get:

In the previous example we have considered only Debt Vs. Equity. But if there is any other debt financing, viz, Preference Share, the above formula takes the following form:
![]()
where , P = stands for Preference Dividend other are same as pointed out above.
Illustration:

Show, the effect of proposed change in EBIT on EPS
Solution:
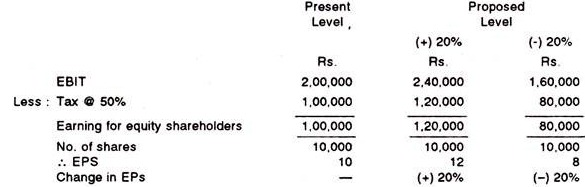
From the above, it becomes clear that if EBIT changes, there will be a corresponding change in EPS. In the above illustration we exclude debt financing. But, in practice, there must be a mix between debt and equity to take the advantage of trading on equity.
Because, such a mix produce a better result and increase the EPS due to the following:
(i) Debt financing is comparatively cheap than the equity capital;
(ii) It does not affect the voting rights among the existing equity shareholders;
(iii) Debt financing increases the yield for equity shareholders till the same does not exceed the explicit cost of such investment; and
(iv) Debt-financing invites the degree of flexibility in the total capital structure of a firm.
Thus, there must be a mix between debt and equity. The following illustration will show how the effect of debt financing affect a disproportional change in EPS from a change in EBIT
Illustration:

Show the effect of proposed change in EBIT on EPS.
Solution:

From the above illustration it becomes quite clear to us that if EBIT changes, them must be a disproportionate change is EPS. So, we can say that financial leverage depends upon the debt-financing in the corporate capital composition.
It can be remembered here that if the amount of debt- financing is proportionality greater in comparison with the equity capital, the degree of financial leverage also will be higher and vice-versa in the opposite case
Illustration:

Compute EPS if the various plans are implemented.
Solution:

From the above illustration it is proved that if the amount of debt financing is increased, there must be a corresponding increase in EPS This is nothing but the effect of trading on equity. Thus, it can safely be said that if the ratio of debt financing is greater, there will be a corresponding greater increase in EPS as long as the rate of return exceeds the financing cost.