
Application of Cost Volume Profit Relationship in Decision Making!
Now let us take a Few Decision Situations:
i. Buying a Spares Versus Taking a Factory on Operating Lease:
CVP analysis is carried using cost variability. Fixed cost remains fixed within a range. All short run decisions is linked to the principle of profit maximization given the cost structure comprising of fixed and variable cost. It speaks about how to make best use of existing resources.
ADVERTISEMENTS:
Operating lease is a type of lease wherein one party takes the asset on lease contract from the second party not for substantial life of the asset. For example, a factory has useful life of 20 years. The owner could not utilize it, and therefore thought to lease it temporarily for a period of 2 years. The first party who takes the asset on lease is termed as “lessee” and the second party who leases out the asset is termed as “lessor”.
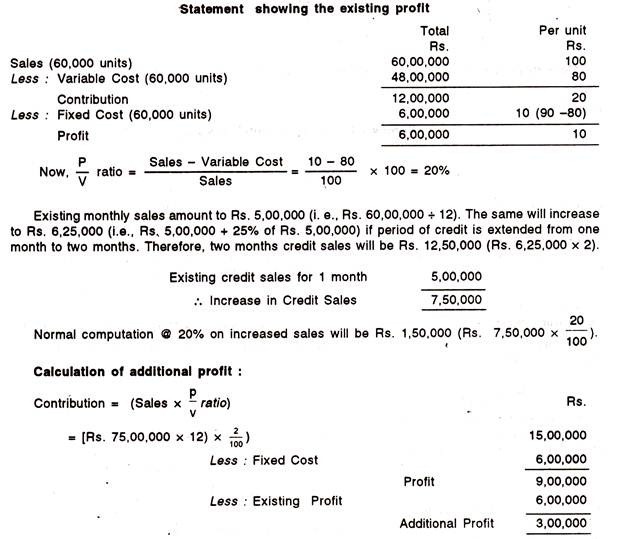
Illustration 1:
X Ltd. buys 100000 pairs of sports shoes @ Rs. 155 per pair, stamps it and packet it which costs @ Rs. 20 per pair. The company sells those shoes through its selling outlets. The production manager has sent a proposal to take a factory on lease, which is available temporarily. He has assessed that the factory has the capacity to produce the requirements of the company. The owner demands a lease rent of Rs. 1700000.
The production manager has asserted that cost of production of the item will be as follows:
ADVERTISEMENTS:
Raw material Rs.100 per pair;
Power and fuel Rs.20 per pair.
No separate stamping will be required. Packaging material will cost @ Rs.12 per pair.
Total labour cost and fixed factory overhead has been estimated at Rs. 800000 and Rs. 400000 respectively. 50% of the workers can be shifted to the plant.
ADVERTISEMENTS:
The question is whether to buy the factory or take on lease a capacity.
Theoretical Framework:
Leasing leads to committing for fixed costs. Entire cost is variable cost in case of buying.
Why didn’t the company create production facilities? The company was not very sure about the demand of the product.
ADVERTISEMENTS:
Taking a capacity on lease creates certain avoidable fixed costs and certain unavoidable fixed costs.
Avoidable Fixed Costs:
ADVERTISEMENTS:
Fixed costs which company can avoid when production level is very low. For example, research and designing. In this example, company will incur fixed factory overhead. What is its origin? It has to enter into a factory maintenance agreement with a maintenance agency at a cost of Rs.200000. This can be avoided once the company does not produce. The operating lease rent has been agreed upon irrespective of the number of units produced. But it is one year agreement.
In case the production level of ultimate product does not justify production, then the agreement can be scrapped. Unavoidable fixed costs: Fixed costs that cannot be avoided when the production level falls. In this example, the company will have to incur labour costs. Although you can calculate per unit labour cost and the recruitment will be made to fully utilize the labour time, what should the company do if the demand for the product falls. It has to pay salary for the 50% of the workers. It can shift 50% of the workers in other jobs.
Solution:

The company would prefer to lease the facilities as that would create a surplus of Rs.14 per unit, le. Rs.14 lac.
ADVERTISEMENTS:
Only hitch that remains in this strategy is unavoidable fixed cost of Rs.400000. If demand falls, the company will losing the margin. Then what is the indifference point?
![]()
In case the sales falls below this level next year, the company can easily shift to buying option cancelling lease agreement and maintenance agreement. But it will not able to avoid 50% of the staff cost, i.e. Rs.400000.
ADVERTISEMENTS:
Should we then treat avoidable cost per unit basis and compute the variable cost including those avoidable fixed costs? This gives avoidable fixed cost adjusted variable cost of Rs.157 for leasing option.
![]()
Should there be sale volume below this level? The company thinks that may not happen. So leasing is a better option.
ii. Exploring Dual Pricing:
Company creates production facilities. It has to incur fixed costs. Demand may not be adequate to fully exploit the capacity.
Illustration 2:
ADVERTISEMENTS:
A company provides the following information: Its unit selling price is Rs.1000 and per unit variable cost is Rs.500. It has fixed cost of Rs.500000. Breakeven point 1000 units. It is presently operating at 1200 units. It could operate maximum at 2500 units. Thus unutilized capacity is 1300 units.

Operation at maximum capacity would create a profit of Rs.750000, whereas it is only earning Rs.100000.
The marketing division started searching new opportunities. Muchkund Ltd. wanted to buy 1300 units @ Rs.700 per unit.
Marketing Manager:
It’s a wholesale buying offer. We can always sell at a different price.
Finance Manager:
Of course, we are now manufacturing above the BEP. The offer price is above the variable cost. It is in fact generating a margin of Rs.200 per unit. On 1300 units we shall be creating Rs.260000 additional surplus. This will only push down the profit graph. In competitive market, we cannot expect to have a straight line profit graph.

Managing Director is not convinced. What could be the reasons.
MD’s Argument:
1. Once you follow differential pricing existing customers may not like the idea.
2. If we enter into an agreement with Muchkund, it may sell back in the market below Rs.1000 per unit, eating up our own market.
3. Our original selling units 1200 include sell to MRS Ltd. which buys 800 units. Why shouldn’t we then offer the same discount to MRS.
Marketing Manager:
Then, what is your final view?
MD:
One Jamali Ltd. asks us to sell @ Rs.875 per unit.
Marketing Manager:
There also you are following dual pricing.
MD:
No. Finance division can calculate the effect if we reduce the price to Rs.900.
Finance Manager:
Here is the comparative profit/loss situation.

The P&L (1) implies our profit/loss at uniform selling price of Rs.1000. P&L (2) shows profit/loss if we follow dual pricing – Rs.1000 for 1200 units and Rs.700 to Muchkund. P&L (3) shows uniform selling price of Rs.875.
MD:
Now what is your view Mr. Marketing Manager?
Marketing Manager:
If this MRS alternative is available, then
MD:
If that is not?
Marketing Manager:
Then ….
MD:
I would still prefer to remain at 1200 units level of production. A company has to be built up by its transparent pricing policy.
iii. Choice of Products – Mix:
A company can also use CVP analysis for selecting products – mix. There may be attraction to manufacture a product which is having best P/V ratio as this will contribute best profit once the breakeven point is reached. But you have learnt that level of fixed cost is equally important. Also there may be constraint of market demand. The company may not be able to sell whatever it produces.
Illustration 3:
Let us now study a products – mix problem:
Maximum production units implies that, if the company utilizes entire machine capacity to produce either of the products then how many units could be produced. Which product should the company manufacture?
Analysis:
You may be tempted to study P/V Ratio and breakeven point and contribution per unit of these products which are given in the above Table.
Now study the ranking of the products as per P/V ratio, Break Even Point and Contribution per unit.
What do you think? Should the company produce C?
No maximum profit can be achieved by producing B.
Theoretical Framework:
Then we need to conceptualize this decision making process through a concept called “contribution per unit limiting factor”.
What is limiting factor?
It implies a scarce production resource. Machine hour is a resource used in the production. It becomes critical as there is unlimited supply of machine hours. Maximum limit is given at 50000 hours. In the short run, the company can’t change it. So it should try to maximize the contribution per unit of machine hour.
All three products consume machine hours in different ways. This means consumption ratio per unit is not uniform. How much contribution is there per machine hour per product?
Product B is the best choice as contribution per machine hour is maximum for this product.
General Principle:
If any one factor of production is scarce or limiting, then find out contribution per unit of limiting factor. Manufacture that product which yield maximum contribution per unit of limiting factor.
Now we should take two limiting factors. Revisit
Illustration 4:
Now there is a demand restriction as well. So there are two limiting factors – Machine Hours 50000 hours and Product-wise Market Demand.
You can’t now manufacture 26316 units of C as its market demand is only 10000.
What should be the products- mix?
There are two limiting factors – Production units and machine hours.
i. If production unit is limiting factor, rank the products as per contribution per unit of limiting factor.
ii. If machine hour is limiting factor, rank the product as per contribution per machine hour.
There is contradiction in ranking between per unit and per machine hour. In such a case always follow the ranking of contribution per machine hour.
You start by product having maximum contribution per unit of machine hour:
Produce B 10000 units and C 10000 units
iv. Dropping a Product Line:
If a product cannot contribute to the common pool or if it does not have the possibility to do so in the long run, the product line should be dropped.
Each and every product line may have its own fixed cost. Therefore, it is better to have a different analytical table than simple structure of Marginal Cost analysis so far discussed.
Illustration 5:
Consider the data given in the following Table
What is your observations about the products line of the company?
Solution:
a) Product A is having moderate variable cost but low fixed cost. Its BEP is lowest and margin of safety is highest. This is the best ranked product.
b) Product B is having low BEP but margin of safety as compared to Product C.
c) Product D is having negative Margin of Safety. With (-) 27% negative Margin of Safety it is difficult to improve. What is the possible demand rise required to reach BEP? 27%. Is this growth achievable in the short run?
Therefore, the recommended product lines are A, B, C. Drop Product D.
How much maximum profit the company can earn?
Ans. Rs.30000.
Illustration 6:
X Ltd. produces product A for which the following details are available.
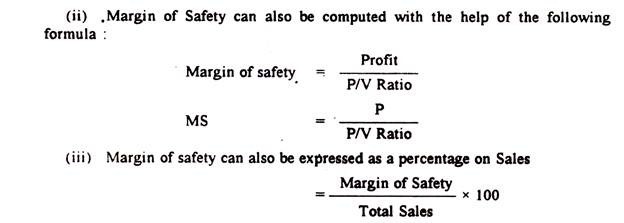
The selling price of the product is Rs.100 and variable cost per unit is Rs.40. Fixed cost is Rs.250000. What is the probability that the company would reach BEP and enter margin of safety zone? Ordinarily a company would like to take 15% risk and does not drop a product within that risk level.
Solution:
Probability = 86%.
Follow the computational steps:
1. Find out mean (X BAR) demand and its standard deviation SD.
2. Find out BEP = 4167.
3. Set the equation for Z = [X – X BARJ/SD = 1.08
4. Probability for Z = 1.08, NORMSDIST (1.08) = 0.1411; this represents the probability that demand will be 4167 or less.
5. Find 1-0.1411 = 0.8519, which is the probability that the product will have demand of 4167 or more.
v. Selection of Capacity Utilization Level:
Fixed cost remains fixed within a range of capacity utilization level. As the capacity utilization level increases fixed factory, administration and marketing cost are bound to rise. This incremental cost may not be supported by incremental revenue. At higher production level, the selling price may come down.
Illustration 7:
A company has installed capacity of 10000 units. It is presently operating at 40% capacity utilization level. Of course, it has got some special offers –
(1) Order 1 Additional 1000 units @ Rs.990 per unit.
(2) Order 2 Additional 1000 units @ Rs.985 per unit
(3) Order 3 Additional 1000 units @ Rs.980 per unit
(4) Order 4 Additional 1000 units @ Rs.975 per unit.
These orders are independent meaning the company could accept/ reject any of them and while carrying out these orders it needs not follow any particular sequence.
A meeting of core decision group has been held. Given below is the extract of the discussion in the meeting:
Factory Manager:
Then we should pick up Order 4 as this customer orders frequently.
Finance Manager:
This non- financial consideration can be taken up at a later stage.
Factory Manager:
What are financial considerations?
Finance Manager:
Select the orders from the highest bids. But our MD generally discourages rate cutting and adopting multiple pricing.
Factory Manager:
No this time he has agreed as our capacity utilization is very low. You only presented that we are working just above the BEP.
Finance Manager:
Yes. I did. You may also study our capacity utilization vis-a-vis financial performance.
Factory Manager:
Don’t show to me. Pass this to Mr. Kapoor.
Marketing Manager:
Yes. That is why I convinced the MD for differential pricing.
Finance Manager:
Mr. Kapoor, still you can have look at our BEP chart.
Our margin of safety is not very encouraging.
At 40% capacity utilization level it is only Rs.50,000.
Marketing Manager:
I also support to carry out Order 4 first. It is all the same.
Finance Manager:
Not to me.
Marketing Manager:
How is it?
Finance Manager:
Let us take care of incremental revenue, incremental cost and incremental profit.
Factory Manager:
Please explain the concepts first.

Incremental Revenue = Sales at 50% – Sales at 40%
Sales at 60% – Sales 50%
ie. differentials in revenue between two production levels.
Incremental cost = Total cost 50% – Total cost 40%
= Total cost 60% – Total cost 50%
= Cost differential between two different production levels
Incremental profit = Profit differential between two different production levels.
Finance Manager:
Then you see sequence of the order in analyzing special offer for financial analysis is required. In practice, you may carry out the orders in any sequence. But let us decide which orders should be accepted. We may not be able to operate at 80% capacity utilization. Fixed cost takes a big jump at 70% level. Perhaps you may not be able to accept Order 4.
Factory Manager:
Why.
Finance Manager:
We need to improve many support facilities in the form of purchasing, warehousing, etc.
Finance Manager:
At 70% level you have negative incremental profit. I would suggest you to accept Orders 1 & 2 only. Thereafter, fixed cost rises because many of the existing facilities will not be sufficient.
Factory Manager:
But Order 4 has incremental profit.
Finance Manager:
No if you put order 4 before order 3, it also suffers incremental loss. Rather at a higher scale.
Factory Manager:
Please show that work sheet.

Analyzing incremental profit:
Factory Manager:
Yes. It is.
Marketing Manager:
This is a partial analysis. Why don’t you take Order 3 & 4 together.
Finance Manager:
I have tried that. Incremental profit would be zero.
Factory Manager:
How is it? Individually these order were having incremental profit – together they produce zero incremental profit.
Finance Manager:
This is the basic behavioural pattern of fixed cost. Our additional fixed cost up to that level is Rs.450000. Incremental variable cost for 2000 units is Rs.15,00,000 and incremental sales is Rs.19,50,000. This gives incremental contribution of Rs.450000. Fixed cost got distributed over large No. of units.
When incremental profit changes sign, be careful that you may not necessarily stop at the level wherein it becomes zero or negative.
Marketing Manager:
If I give you two more offers of 1000 units each @ Rs.960 per unit, would allow?
Factory Manager:
Then we should operate at 100% capacity.
Finance Manager:
Up to 80% capacity utilization level, my suggestion was to remain at 60% at the given level of fixed costs and selling price. But at 100% level I may change my opinion. Fixed cost got more or less stabilized. You may go ahead with all orders then.
Marketing Manager:
What is the theory?
Finance Manager:
Incremental profit may move, from negative to positive region. Remain careful if incremental profit is re-entering positive zone. Once it does so, this adds to your total profit.

You should remain careful at 3 and 4 increments. You get 5th and 6th increments, scenario gets changed.
vi. Sale or process further:
You may apply the incremental cost, revenue, and profit approach while deciding whether to sale a product at intermediate level or process a step further.
Illustration 8:
A company is producing and selling 10000 kg of a chemical at its 50% capacity. No further demand has been projected. Selling price pu is Rs.500 per kg., variable cost is Rs.300 per kg. and fixed cost is Rs.1200000. It increases at a step of Rs.100000 per 10% additional capacity utilization.
The factory manager proposed to process the chemical further utilizing 30% additional capacity. Finance manager has evaluated his proposal from cost angle and reported that additional variable cost of further processing is Rs.50 per unit. Marketing manager reported a selling price of Rs.600 per unit.
Everyone is enthusiastic about processing further. What is your view? Incremental selling per unit Rs.100 Incremental variable cost Rs.50 per unit Additional fixed cost Rs.300000
To cover additional fixed cost, you need Rs.30000/Rs.50 = 6000 units
So the company can process further.
Yes. The reason for enthusiasm is this new proposal can successfully increase the capacity utilization. The company should go for it.
vii. Outsourcing services:
Purchasing, repairs, maintenance of guest house, security system are available from specialized agencies. Should a company outsource these services or strengthen efficient internal service department?
The solution simply lies upon the internal efficiency and volume of service to be generated.
Illustration 9:
The finance manager of a company studied that machine maintenance department creates 1000 repair hours at a cost of Rs.400000. A specialized repair shop offers Rs.300 per repair hour. Therefore, he emphasizes that repair work should be outsourced.
The repairs department talked about the quality of the repair works. Also there is no adequate work available. The department can generate another 800 repair hours. But the repair shop offers guarantee of the work done.
The head of the repair department submitted counter proposal to sell repair hours @ Rs.260 per hour to another company and earn Rs.208, 000. Also the internal repair hour may rise in the near future by 25%.What should be the decision?
Solution:
Net cost of the repair department: Rs.400000 – Rs.208000 = Rs.192000
Cost per repair hour = Rs.192000/1000 = Rs.192 < Rs.300
Outsourcing should be evaluated in a proper perspective. Since there is a good differential between effective cost of the internal department and outsourcing, even if the sale of facilities is overestimated still it may be a better proposition. Even if the department can sell 231 units, it would cost the same.
At 25% increase in repair requirement, internal facilities would be efficient.