
The following points highlight the five main elements of cost-volume-profit analysis. The elements are: 1. Marginal Cost Equation 2. Contribution 3. Profit/Volume (P/V) Ratio 4. Break Even Point 5. Margin of Safety.
Cost-Volume-Profit Analysis: Element # 1. Marginal Cost Equation:
For the sake of convenience, elements of costs can be written in the form of an equation as follows:
Sales = Variable Costs + Fixed Expenses ± Profit/Loss
or Sales – Variable Costs = Fixed Expenses ± Profit/Loss
ADVERTISEMENTS:
or S − V = F±P where ‘S’ stands for sales, V for variable costs, F for fixed expenses,
+ P for profit and – P for loss,
or S−V = C because F ± P, i.e., Fixed Expenses ± Profit/Loss = Contribution.
In order to make profit, contribution must be more than the fixed expenses and to avoid any loss, contribution must be equal to the fixed expenses.
ADVERTISEMENTS:
The marginal cost equation of S − V = F ± P is very useful to find any of the four factors, i.e., S, V, F or P if three of these factors are known.
Illustration 1:
Determine the amount of fixed expenses from the following particulars:
Sales Rs.2, 40,000: Direct Materials Rs.80,000; Direct Labour Rs.50,000; Variable Overheads Rs.20,000 and Profit Rs.50,000.
ADVERTISEMENTS:
Solution:
The Marginal Cost Equation is
S – V = F + P
S or Sales = Rs.2, 40,000
ADVERTISEMENTS:
V or Variable Costs = Rs.80,000 + Rs.50,000 + Rs.20,000 = Rs.1, 50,000
(Direct Materials + Direct Labour + Variable Overheads)
P or Profit = Rs.50,000
F or Fixed Expenses = ? (not given)
ADVERTISEMENTS:
Applying the figures in the equation S – V = F + P, we get
Rs.2, 40,000 – Rs.1, 50,000 = F + Rs.50,000
or Rs.2,40,000 − 1 1,50,000 – Rs.50,000 = F
or Rs.40,000 = F
ADVERTISEMENTS:
... Fixed Expenses = Rs.40,000.
Cost-Volume-Profit Analysis: Element # 2. Contribution:
Contribution is the difference between the sales and the marginal cost of sales and it contributes towards fixed expenses and profit. Suppose selling price per unit is Rs.15, variable cost per unit is Rs 10, fixed cost is Rs.1,50,000, then contribution per unit will be Rs.5 (selling price – marginal coat i.e., Rs.15 – Rs.10).
Contribution for 30,000 units @ Rs.5 is Rs.1, 50,000 which is sufficient only to meet the fixed costs of Rs.1,50,000 and no amount is left for profit. If output is 20,000 units, contribution is Rs.1, 00,000 (i.e., 20,000 x Rs.5) which is not sufficient to meet fixed expenses of Rs.1, 50,000 and the result is a loss of Rs 50,000.
An output of 40,000 units will give a contribution of Rs.2, 00,000 (i.e., 40,100 x Rs.5) which will be sufficient to meet fixed cost of Rs.1, 50,000 and leave a profit of Rs.50,000. Thus, contribution will first go to meet fixed expenses and then to earn profit.
ADVERTISEMENTS:
Contribution can be calculated as under:
Contribution = Selling Price − Marginal Cost
or = Fixed Expenses ± Profit/Loss
or = Sales x P/V Ratio
In marginal costing, contribution is very important as it helps to find out the profitability of a product, department or division, to have better product mix, for profit planning and to maximise the profits of a concern.
Profit:
ADVERTISEMENTS:
Profit is the net gain in activity or the surplus and remains after deducting fixed expenses from the total contribution.
Profit can be calculated as under:

Difference between Contribution and Profit:
Contribution is different from profit. Following are the main differences between Contribution and Profit:
Contribution:
1. Includes fixed cost and profit.
2. Based on marginal cost concept.
3. Contribution above break even point to profit.
4. Contribution analysis requires a knowledge of break even concept.
Profit:
1. Does not include fixed cost.
2. Based on common man concept.
3. Profit is expected only after covering variable and fixed costs.
4. Profit does not require any such concept.
Cost-Volume-Profit Analysis: Element # 3. Profit/Volume (P/V) Ratio:
Profit/volume ratio is one of the most important ratios for studying the profitability of operations of a business and establishes the relationship between contribution and sales. This ratio is calculated as under:

In the above example, for every Rs.100 of sales, contribution is 50%. A sale of every Rs.100 will bring a profit of Rs.50 after fixed expenses are met. Comparison of P/V ratios for different products can be made to find out which product is more profitable. Higher the P/V ratio, more will be the profit and lower the P/V ratio, lesser will be the profit. Hence, it should be the goal of every concern to increase or improve the P/V ratio.
It can be done by:
(a) Increasing the selling price per unit.
(b) Reducing direct and variable costs by effectively utilizing men, machines and materials.
(c) Switching the production to more profitable products or increasing the proportion of sales of products showing a higher P/V ratio.
(d) Reducing the share of low margin products in the total sales and increasing the share of high margin products.
P/V ratio is very useful and is used for the calculation of:

Illustration 2:
Calculate P/V Ratio from the following informal on:
(i) Given: Selling price Rs 10 per unit, Variable cost per unit Rs.6.
(ii) Given the profits and sales of two periods as under:

Solution:

Cost-Volume-Profit Analysis: Element # 4. Break Even Point:
A business is said to break even when its total sales are equal to its total costs. It is a point of no profits no loss. At this point, contribution is equal to fixed cost. A concern which attains breakeven point at less number of units will definitely be better from another concern where breakeven point is achieved at more units of production.
The breakeven point can be calculated by the following formula:

Break Even Point Based on Total Sales:
Marginal cost equation is:

Illustration 3:
From the following particulars calculate:
(i) Contribution
(ii) P/V Ratio
(iii) Breakeven point in units and in rupees,
(iv) What will be the selling price per unit if the breakeven point is brought down to 25,000 units?
(v) How many units are to be sold to earn a net income of 20% on sales?
Fixed Expenses Rs.1,50,000; Variable Cost per unit Rs.10; Selling Price per unit Rs.15. Solution:
![]()

Illustration 4:
Star Ltd. manufactures and sells a standard product at fixed selling price.
The budgeted figures for the year 2010 are as under:
![]()
You are required to determine selling price per unit and sales at break-even point in terms of quantity and value at the above selling price for the budgeted year.
Solution:

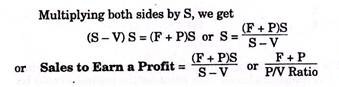
Calculation of Output or Sales Value at which a Desired Profit is earned:
The formula for the calculation of output to earn a certain amount of profit is as follows:

Composite B.E.P:
A business undertaking may have different manufacturing establishments each having its own production capacity and fixed cost but producing the same product. At the same time, the concern as a whole is a unit having different establishments under the same management. Hence, the combined fixed costs have to be met by the combined BEP sales.
In this analysis, there are two approaches namely:
(i) Constant product mix approach
(ii) Variable product mix approach.
Under the first approach, the ratio in which the products of the various establishments are mixed is constant. The mix will be maintained at BEP sales also. Under the second approach, that product of the establishment would be preferred where the contribution ratio is bigger.
Illustration 5:
‘A’ Limited has two factories X and Y producing the same article whose selling price is Rs 150 per unit.
Following are the other particulars:

Determine the B.E.P. for the two factories and for the company as a whole assuming (a) constant sales mix and (b) variable sales mix.
Solution:

Note: constant sales mix is in proportion to the capacities of two factories i.e., 10,000 units: 15,000 units or 2 : 3
(b) Variable Sales Mix:
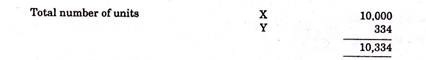
As factory X is giving a higher contribution, it shall be used in full i.e. 10,000 units should be produced here before production is commenced at Y. This will give a contribution of Rs.5, 00,000. (i.e. 10,000 units @ Rs.50) Total fixed expenses for the two factories are Rs.5, 10,000. Additional contribution required to meet the fixed expenses fully Rs.10,000. No. of units to be produced at factory Y to produce the
Contribution of Rs.10,000/ Rs.30 = 334 units
The above discussion could be applied to an undertaking selling different products each having its own contribution and sales potentials. The composite breakeven point for the business could be worked out keeping the product mix constant. This would involve working out a composite P/V ratio as in the above case.
Illustration 6:
A company is producing an identical product in two factories.
Following are the details in respect of both the factories:

Note: Indicate BEP in units
Solution:

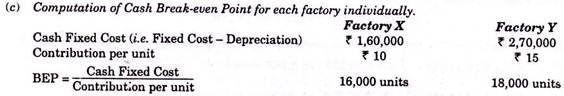
(b) Which factory is more profitable will depend on the level of production. If the production is 20,000 units only at each factory both are equally ‘profitable’ since both have their break-even points at this level. If the output is less than 20,000 units, factory X will give lower loss @ Rs.10 per unit of the shortfall below the break-even point, whereas the loss will be Rs.15 per unit in case of factory Y.
Production in excess of 20,000 units will make factory Y more profitable since each extra unit produces a profit of Rs.15 per unit as compared to Rs.10 per unit in case of factory X. However, in case, choice is to be made as to whose capacity is to be utilized first, choice should be for Y since it give s a higher contribution per unit.
(d) Computation of Break-even Point for the company as a whole, assuming the present mix, i.e., 3: 2 Combined Contribution = (3/5 x Rs 10) + (2/5 x Rs 15) = Rs 12

Cost-Volume-Profit Analysis: Element # 5. Margin of Safety:
Margin of safety is the difference between the actual sales and the sales at breakeven point. One of the assumptions of marginal costing is that output will coincide sales, so margin of safety is also the excess production over the break even point’s output.
Sales or output beyond breakeven point is known as margin of safety because it gives some profit, at breakeven point only fixed expenses are recovered. Margin of safety can also be expressed in percentage. For example, if present sales are Rs.4,00,000 and break even sales are Rs.3,00,000, margin of safety is Rs.1,00,000 i.e.,

Margin of safety is that sales or output which is above breakeven point. All fixed expenses are recovered at breakeven point; so fixed expenses have been excluded from the formula of margin of safety given above. Margin of safety is that sales which give us profit after meeting fixed costs, therefore, formula of its calculation takes only profit.
If the margin of safety is large, it is an indicator of the strength of a business because with a substantial reduction in sales or production, profit shall be made. On the other hand, if the margin is small, a small reduction in sales or production will be a serious matter and lead to loss.
The margin of safety at breakeven point is nil because actual sales volume is just equal to the break even sales. Efforts should be made by the management to increase (or improve) the margin of safety so that more profit may be earned.
This margin can be increased by taking the following steps:
(i) Increase the level of production (sales volume) provided the capacity is available.
(ii) Increase the selling price.
(iii) Reduce the fixed or the variable costs or both.
(iv) Substitute the existing products by more profitable products.
(v) Modernisation of production facilities and the introduction of the most cost effective technology.
In inter-firm comparison margin of safety may be used to indicate the relative position of firms.
Illustration 7:
A company has fixed expenses of Rs.90,000 with sales at Rs.3, 00,000 and a profit of Rs.60,000 during the first half year. If in the next half year, the company suffered a loss of Rs.30,000, calculate:
(a) The P/V ratio, breakeven point and margin of safety for the first half year.
(b) Expected sales volume for next half year assuming that selling price and fixed expenses remain unchanged.
(c) The breakeven point, and margin of safety for the whole year.
Solution:


Illustration 8:
Assuming that the cost structure and selling prices remain the same in periods I and II, find out:
(а) Profit Volume Ratio;
(b) Fixed Cost;
(c) Break Even Point for Sales ;
(d) Profit when Sales are of Rs 1,00,000 ;
(e) Sales required to earn a Profit of Rs 20,000 ; and
(f) Margin of Safety at a Profit of Rs 15,000 ;
(g) Variable Cost in Period II;
(h) Sales to earn a profit of 10% on sales.

Solution:

Illustration 9:
E Ltd. manufacturers and sells a single product X whose price is Rs.40 per unit and variable cost is Rs.16 per unit. If the fixed costs for the year are Rs.4,80,000 and the annual sales are at 60% Margin of Safety, calculate the rate of return on sales, assuming an income tax level of 35%.
Solution:


Illustration 10:
(a) Given the following, calculate P/V ratio and profit when sales are Rs.20,000:
(i) Fixed cost Rs.4,000
(ii) Break-even-point Rs.10,000.
(b) Given the following, find the margin of safety sales:
(i) Profit earned Rs.24,000
(ii) Selling price per unit Rs.10
(iii) Marginal cost per unit Rs.7.
(c) From the following data, find out:
(i) Sales; and
(ii) New break-even sales, if selling price is reduced by 10%:
Fixed cost Rs.4,000; Break-even sales Rs.20,000; Profit Rs.1,000 and selling price per unit Rs.20.
(d) From the following data, compute break-even sales and margin of safety: Sales Rs.10, 00,000; fixed cost Rs.3, 00,000; and Profit Rs.2, 00,000.
(e) From the following data, calculate break-even point (BEP):
Selling price per unit Rs.20; Variable cost per unit Rs.15 and Fixed overheads Rs.20,000. If sales are 20% above ESP, determine the net profit.
(f) The fixed costs amount to Rs.1, 50,000 and the percentage of variable costs to sales is given to 66⅔%. If 100% capacity sales at normal are Rs.9, 00,000, find out the breakeven point and the percentage sales when it occurs. Determine profit at 80% capacity sales.
(g) A company has a fixed cost of Rs.2, 00,000. It sells two products—X and Y in the ratio of 2: 1. If contribution of X is Rs.10 per unit and of Y is Rs.20 per unit, how many units of each X and Y would be sold at break-even point?
(h) The ratio of variable cost to sales is 60%. The break-even-point occurs at 80% of sales. Fixed costs are Rs.2, 00,000. Find the sales capacity and the sales at break-even-point. Also determine profit at 90% and 100% sales capacity.
Solution:


Illustration 12:
A company has annual fixed costs of Rs.14, 00,000. In 2010 sales amounted to Rs.60, 00,000 as compared with Rs.45, 00,000 in 2009 and profit in 2010 was Rs.4, 20,000 higher than in 2009:
(i) At what level of sales does the company break-even?
(ii) Determine profit or loss on a present sales volume of Rs.80, 00,000.
(iii) If there is reduction in selling price in 2010 by 10% and the company desires to earn the same profit as in 2010, what would be the required sales volume?
Solution:

Illustration 13:
MNP Ltd. sold 2, 75,000 units of its product at Rs.37.50 per unit. Variable costs are Rs.17.50 per unit (manufacturing costs Rs.14 and selling cost Rs.3.50 per unit). Fixed costs are incurred uniformly throughout the year and amount to Rs.35, 00,000 (including depreciation of Rs.15, 00,000) there are no beginning or ending inventories.
Required:
(i) Estimate break-even sales level quantity and cash break-even sales level quantity.
(ii) Estimate the P/V ratio.
(iii) Estimate the number of units that must be sold to earn an income (EBIT) of Rs.2, 50,000.
(iv) Estimate the sales level achieves an after-tax income (PAT) of Rs.2, 50,000. Assume 40% corporate Income Tax rate.
Solution:

Illustration 14:
An analysis of costs of Sullivan Manufacturing Company led to the following information:

You are required to determine:
(i) The break-even sales volume,
(ii) The profit at the budgeted sales volume,
(iii) The profit, if actual sales—
(a) Drop by 10 per cent.
(b) Increase by 5 per cent from budgeted sales.
Solution:
Percentage of variable cost to sales is 79% calculated as follows:

