
After reading this article you will learn about the meaning and ascertainment of cost-volume-profit.
Meaning of Cost-Volume-Profit:
We know that profit is one of the most important factors while measuring business/ firm’s performances. Micro economic theory tells us that profit is a signal for the allocation of resources and a yardstick for measuring managerial efficiency in a market economy.
Moreover, we know that the primary objective of running a business enterprise is to earn profits which not only determine liquidity and solvency position, but also the financial position as a whole. Thus, the profit planning is the fundamental part of management function.
And in order to realise the goals, the management prepares the budgets which will actually help them to realise the same. Needless to mention here that the same is possible only when the information about the cost (both fixed and variable) and the selling price of the product is available in the hands of the management.
ADVERTISEMENTS:
Because, the profit is affected by many factors, such as:
(i) Variable Cost per unit;
(ii) Total fixed Cost;
(iii) Volume of sales;
ADVERTISEMENTS:
(iv) Selling prices per unit of the product; and
(v) Sales mix.
The Cost-Volume-Profit (CVP) is nothing but practically a management accounting tool to show the relationship between these ingredients of profit planning. Thus, the whole gamut of profit planning is related to Cost-Volume-Profit (CVP) relationship in Break-Even Analysis through Marginal Costing.
Ascertaining of Cost-Volume-Profit (CVP):
In order to ascertain the Cost-Volume-Profit (CVP) relationship the following matters are absolutely desired:
ADVERTISEMENTS:
A. Marginal Cost Formula or Contribution etc. (Marginal Costing);
B. Profit-Volume Ratio (P. V. Ratio); and
C. Break-Even Analysis.
A. Marginal Costing:
ADVERTISEMENTS:
According to the terminology of Cost Accounting, Institute of Cost and Management Accounts, England, “Marginal Costing is the ascertainment of marginal cost and of the effect on profit of changes in volume or type of output by differentiating between fixed and variable Cost.”
Similarly, the same is defined by the Institute of Cost and Management Accountants as, “The amount at any given volume of output by which aggregate cost are changed if the volume of output is increased or decreased by one unit. In practice, this is measured by the total variable cost attributable to one unit.”
According to the Institute of Chartered Accountants of England, “Marginal Cost is every expense (whether of production, selling, distribution) increased by the taking of a particular decision.”
The marginal cost is the cost for producing additional unit or units by segregation of fixed cost (i.e. cost of capacity) from variable cost (i.e. Cost of production) which helps to know the profitability through Profit-Volume Ratio and Break-Even analysis.
ADVERTISEMENTS:
Moreover, we know, in order to increase the production certain expenses (fixed) may not increase at all, only some expenses relating to materials, labour and variable expenses are increased. Thus, the total cost so increased by the production of one unit or more is the cost of marginal unit and the cost is known as marginal cost or the same may also be turned as incremental cost.
So, the significant purposes from the above are:
(a) Ascertainment of marginal cost; and
(b) Ascertainment of Cost-Volume-Profit by differentiating between fixed cost and variable cost.
ADVERTISEMENTS:
Marginal Cost is sometimes used as Direct Costing, Variable Costing, Contributory Costing, Differential Costing, Fundamental Costing etc. In U.S.A. the term direct costing is used.
Since the marginal cost consists of variable expenses, like raw material, labour and variable overhead, it may be said that the marginal cost consists of variable cost only.
Examples:
Output produced p a. 1000 unit
ADVERTISEMENTS:
Variable Cost @ Rs. 15 per unit
Total fixed Cost Rs. 5,000 p a.
Total Cost will be calculated as under:

ADVERTISEMENTS:
Now, If the Production is Increased by one i.e 1001, the Total Cost will be

Illustration:
X Ltd is currently working at 50% capacity and produces 10,000 units.
At 60% working, raw material cost increases by 2% and selling price falls by 2%. At 80% level, raw material cost increases by 5% and selling prices falls by 5%.
At 50% capacity working, the production cost is Rs. 180 per unit and is sold at Rs. 200 per unit.
The unit cost of Rs. 180 is made up as follows:

Prepare a Marginal Cost Statement showing the estimated profit of the business When it IS operated at 60% and 80% capacity.

Contribution:
Contribution is the excess of sales over variable cost which is also known as total margin (distinguished from profit). Contribution at first contributes towards the fixed overhead and when the fixed overhead are recovered the same contributes towards profit.
Now, contribution may also be considered from another standpoint i.e., where from does it comes? [Sales — Variable Cost — Contribution Equation] and how the same is applied [Profit-Fixed Overhead-Contribution Equation] Contribution is algebraically represented as under:

The Contribution so calculated with help of the above equation may also be derived under:

Illustration:
 Illustration:
The following information is given about X Ltd. as on 31st December 1993:

The company has two products:
Super which sells for Rs. 100 per unit and Grand, which sells for Rs. 50 per unit.
During the year sales were as follows:
Super 80,000 units
Grand 1, 20,000 units
Production costs (cost of goods sold) were as follows: Super Rs. 20 per unit and Grand Rs. 3.3333 per unit, advertising expenses were approximately 50% of the sales of each product. Warehousing expanses are variables based on the number of units sold.
Transportation costs were included equally for each product:
(a) Compute the contribution to net earnings for Super and Grand.
(b) Computes the total unit cost (production and marketing costs) of super and grand.
Solution:
(a) Statement showing the contribution to net earning of Super and grand.

B. Profit/Volume Ratio (P/V Ratio):
Profit/Volume Ratio, commonly known as P/V Ratio, is the ratio of Contribution to Sales. This ratio is also known as Marginal Income Ratio, Contributions/ Sales Ratio or, Variable Profit Ratio. The ratio may also be expressed in terms of percentage (%).
This ratio may be expressed as under:
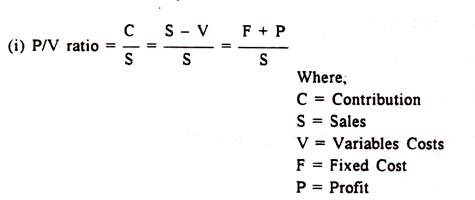
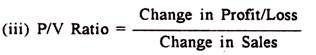
This ratio may be expressed by change in contribution in relation to change in sales.
That is:
P/V Ratio = Change in Contribution / Change in Sales
Similarly, when total fixed cost, until selling prices, unit variable cost remains constant, this ratio takes the following form:
Now, with the help of P/V ratio, we find out contribution, sales, Break-Even Point (BEP) i.e., no profit (no loss point), sales required for a desired profit, and profit against a particular amount of sales.
The following equation will make the above relationship clear:

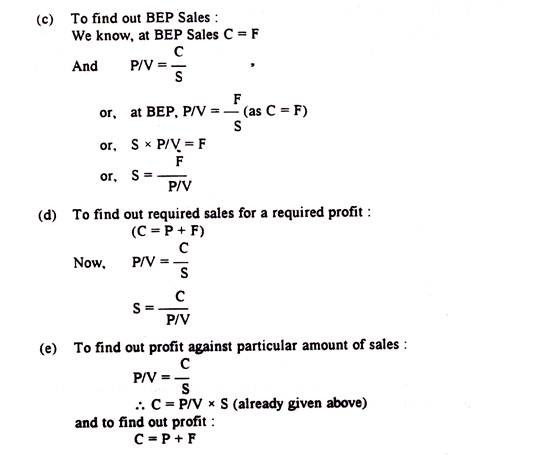
Illustration:
Find out:
(i) P/V Ratio;
(ii) BEP Sales;
(iii) Net Profit from Rs.75,000 Sales; and
(iv) sales required for a profit of Rs. 75,000 if sales amount to 50,000 and net profit amount to Rs. 5,000 and fixed overhead are Rs.7,500.
Solution:


Improvement in P/V Ratio:
It means widening the gap between the actual sales and variable costs.
The same can be done with the help of:
(i) Increasing the selling prices;
(ii) Reducing the variable costs; or
(iii) A more profitable mix of sales.
It should be remembered here that a reduction in fixed cost does not affect the P/ V ratio (but it increases the amount of total profit) since it is a function of contribution to sales.
Application of P/V ratio:
A P/V ratio may be used for the following:
(i) Ascertaining BEP and Margin of Safety;
(ii) Ascertaining the variables cost for any volume of sales;
(iii) Fixing the selling price;
(iv) Ascertaining profit for a particular volume of sales;
(v) Ascertaining the volume of sales for a desired profit;
(vi) Ascertaining sales mix in order to earn minimum profit;
(vii) Selecting the most profitable line of products particularly when there is no key factor.
Key or Limiting Factor:
The factors which sets a limit to the activity is known as Key factor which influences budgets. It is also called Limiting factor or Governing factor or principle budget factor. For example, there may be a high demand for a particular product, but due to non-availability of the supply of raw materials, production may have to be restricted and this factor is known as key factor.
It is highly significant during the budgeting for production or sales. Sometimes, there may be several key factors, such as, labour, capital, sales, etc.
However, the following are the examples of key factor:

1. Materials:
(i) Availability of supply;
(ii) Restriction imposed by licences, quotas, etc.;
2. Labour:
(i) General Shortage;
(ii) Shortage of skilled labour;
3. Sales:
(i) Consumer demand
(ii) Inadequate advertising and warehousing facilities;
(iii) Dearth of experienced or successful salesmen;
4. Plant:
(i) Limited capacity due to lack of capital;
(ii) Limited capacity due to lack of space;
(iii) Insufficient capacity due to shortage of supply;
(iv) Bottleneck in certain key processes;
5. Management:
(i) Shortage of efficient executives,
(ii) Insufficient Capital.
The key factor does not create any permanent problem to the business operations since it is possible to solve any problem with proper management action in future through a number of devices. From the above, it is quite clear that decision must be taken whether to make one product or another.
Usually, if there is no limiting factor, promotion selection depends on P/V ratio, i.e., the product which has highest P/V ratio will be selected. But, if there is any key factor, selection of product depends on the pairs of contribution per unit of key factors.
But it should be remembered that this principle is applicable only when there is one key factor, the more profitable is the product. When sales is the key factor (i.e., if sales cannot exceed a given quantity), the profitability is measured by P/V ratio.
Thus, profitability is measured by:

The following Illustration will, however, clear the above principal.
Illustration:
From the following particulars of the product of XY Ltd. viz. Product X, and Product Y. comment on the relative profitability:

Solution:

From the above profitability statement, it becomes crystal clear that total profit as well as contribution per unit is higher in case of product X although profit per unit in case of product Y is higher. Now, if output is key factor, product X is naturally more profitable. On the other hand, if there is no key factor about units of output of product Y, the same is more profitable.
At the same time, if there is any other key factor, contribution has to be expressed in terms of that factor and appropriate decision should be taken accordingly.
Illustration:
(a) The following particulars are extracted from the records of a company:

Direct Wages per hour is Rs. 5. Comment on profitability of each product (both use the same raw materials) when:
(i) Total sales potentials in units are limited;
(ii) Total sales potentials in values are limited;
(iii) Raw materials are in short-supply;
(iv) Production capacity (in terms of machine hours) is the limiting factor.
(b) Assuming raw materials as key factor, availability of which is 10,000 k g., and maximum sales potential of each product being 3,500 units, find out the product mix which will yield the maximum profit.
Solution:

(b) Needles to mention here that product preference will be selected on the basis of (a) (iii) stated above bearing in mind that maximum demand for each of the two product is 3,500 units i.e., 3,500 units of more profitable product will be produced first and the balance of available materials will be utilised in order to produce less profitable product.
So, the optimum product mix will be as under:

Another key factor may also appear from the demand side of the product. Then, the ranking will depend on the relative contribution per unit of key factor and as such, selection of product will depend on it. It should be remembered that number of units of a product should be selected in the mix which again depends on the demand for the same.
C. Break-Even-Analysis:
Break-Even expresses the volume of sales at which no profit or no loss is made, i.e., that level of activity where total cost equals to total selling price, or where the contribution exactly equals fixed overhead. It is also, called an Equilibrium point or Balancing point.
Now, if the production is increased beyond this level, profit will accrue and if it decreases, loss shall be suffered. Thus, this analysis shows the relationship between Cost-Profit and Volume clearly which is very helpful for profitability analysis. For this reason this analysis also goes by the name of Cost-Volume- Profit analysis.
Break-Even Point:
Break-Even point is the point which expresses or breaks the total cost and the selling price evenly in order to show the level of sales or where no profit/no loss is made. At this point, incomes are equal to expenditure. It has already been pointed out above that if the production is increased beyond this level, there will be profit or vice-versa.
The Break-Even Point of sales can be determined with the help of the following:

We know that at Break Even point the desired profit is zero. Now, if a particular amount of profit is desired, that will have to be asses with fixed cost. Then,

Illustration:
From the following particulars, find out the Break-Even point in units and in Values and also profit earned and state also what should be the amount of sales for earning a profit of Rs. 30,000 ?

Illustration:
A factory engaged in manufacturing plastic buckets is working at 40% capacity and produces 10,000 buckets p a.
The present cost break-up for one bucket is as under:
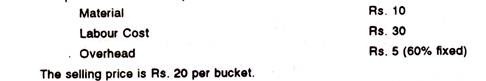
If it is decided to work the factory at 50% capacity, selling price falls by 3%. At 90% capacity, the selling price falls by 5% accompanied by a similar fall in the prices of materials. You are required to calculated the profit at 50% and 90% capacities and also calculate Break-Even point for the same productions.
Margin of Safety:
Margin of safety is the difference between actual sales or output and the Break- Even sales or output, (i.e Total sales – Break-Even Sales). It may be expressed as a percentage. No doubt, a greater margin of safety indicates the soundness of the business.
The unsatisfactory margin of safety can be rectified by lowering variable or fixed cost, by increasing selling price or by substituting unprofitable product by profitable product. Margin of safety is shown with the help of a graph in Fig. 4.2 subsequently.


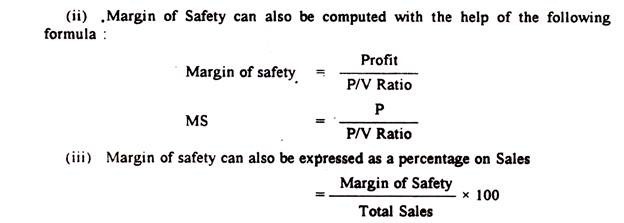
Illustration:
The following particulars are presented by ABC Ltd for 1994:
Find out:
(i) PA/ Ratio, Break-Even sales, Margin of Safety at this level.
(ii) Also calculate the effect of:
(a) 10% increase in Fixed Cost;
(b) 10% decrease in variable Cost;
(c) 10% increase in selling price, and
(d) 10% decrease in sales which are accompanied by 10% decrease in Variable Cost.
Solution:


Angle of Incidence:
This is an angle where sales line intersects the total cost line which indicates profit earning capacity over the Break-Even Point. It should be remembered that a large angle indicates high margin of profit after covering fixed cost.
Similarly, a small angle indicates low margin of profit which reveals that variable cost is more in total cost. If margin of safety is considered along with angle of incidence it may be suggested that a large angle of incidence with high margin of safety indicates extremely favourable condition.
The following graph will show the ‘Angle of incidence ‘ of a firm:

Curvilinear Cost-Volume-Profit Analysis:
Selling price per unit and variable cost per unit are constant which shows the BEC as straight line But in reality that is not always possible due to certain factors; if selling price per unit is changed due to increase or decrease in the volume of sales or the variable cost per unit change due to diminishing returns since the volume of sales goes up beyond a certain limit, BEC will take a curvilinear shape.
There are some authors who are of option that traditional CVP analysis is only of theoretical importance. In this respect we may refer to the economists’ concept about the CVP analysis.
According to them:
(i) Marginal cost represents the change in the aggregate cost if the volume of output is changed by one unit;
(ii) As selling price are reduced demand increases;
(iii) As the volume of production increases, the total costs increase, first as a declining rate, then at a constant rate for a long range due to economies of scale, and thereafter at an increasing rate to give diminishing return due to setting in of operational inefficiencies etc.’
The following graphs will explain the said principle clearly:

