
List of Ratio Analysis Formulas and Explanations!
Profitability Ratios:
Profit making is the main objective of business. Aim of every business concern is to earn maximum profits in absolute terms and also in relative terms i.e., profit is to be maximum in terms of risk undertaken and capital employed. Ability to make maximum profit from optimum utilisation of resources by a business concern is termed as “profitability”. Profit is an absolute measure of earning capacity.
Profitability depends on sales, costs and utilisation of resources. Profitability analysis consists of different elements i.e., study of sales, cost of goods sold, analysis of gross margin on sales, analysis of operating expenses, operating profit and analysis of profit in relation to capital employed.
The following are various ratios used to analyse profitability:
1. Return on Investment (or) Overall Profitability Ratio:
ADVERTISEMENTS:
This ratio is called ‘Return on Investment’ (R.O.I) or ‘Return on capital employed’. It measures the sufficiency or otherwise of profit in relation to capital employed.
Return on capital employed is calculated by using the following formula:
Formula:
![]()
The term operating profit means profit before interest and tax.
ADVERTISEMENTS:
The term capital employed has been interpreted in different ways by different accountants and authors.
Some of the different meanings of capital employed are given below:
(1) Total of all assets i.e., fixed as well as current assets.
ADVERTISEMENTS:
(2) Total of fixed assets.
(3) Total of long-term funds employed in the business.
i.e., (Share capital + Reserves and Surplus + Long-term loans)-(Non business assets + Fictitious assets)
(4) Net working capital + Fixed assets.
ADVERTISEMENTS:
Return on investment is used to measure the operational and managerial efficiency. A comparison of ROI with that of similar firms, with that of industry and with past ratio will be helpful in determining how efficiently the long-term funds of owners and creditors being put into use. Higher the ratio, the more efficient is the use of the capital employed.
Return on investment can be computed for measuring the return for various purposes.
Some of the purposes for which the ratios are calculated are explained below:
(a) Return on Shareholders’ Funds:
ADVERTISEMENTS:
This ratio determines the profitability from the shareholder’s point of view.
Formula:
![]()
The net profit here is net income after payment of interest and tax and it includes net non- operating income also, (i.e., Non-operating income minus non- operating expenses).
ADVERTISEMENTS:
The term shareholders’ funds includes equity share capital, preference share capital and all reserves and profits belonging to shareholders.
(b) Return on Equity Shareholders Funds (or) Return on Equity (or) Return on Net Worth:
This ratio signifies the return on equity shareholders’ funds. The profit considered for computing the ratio is taken after payment of preference dividend.
The ratio of return on equity shareholders’ funds is calculated as given below:
ADVERTISEMENTS:
Formula:

The term equity shareholders’ funds (or) Equity (or) Net worth refers to equity share capital + Reserves + Profits – Accumulated losses
(c) Return on Total Assets:
This ratio is calculated to measure the productivity of total assets. There are-two ways of calculating this ratio.
Formula:

The term fictitious assets refer to preliminary expenses, debit balance of Profit and Loss Account and other similar losses shown on Balance Sheet asset side.
2. Gross Profit Ratio:
This ratio is also known as Gross margin or trading margin ratio. Gross profit ratio indicates the difference between sales and direct costs. Gross profit ratio explains the relationship between gross profit and net sales.
Formula:
![]()
A higher ratio is preferable, indicating higher profitability.
A higher ratio will be due to the result of one or more of the following factors:
(1) Increase in selling price without change in the cost of goods sold.
(2) Decrease in cost of goods sold, with selling price remaining constant.
(3) Increase in selling price and decrease in cost of goods sold.
(4) Increase in the sales mix, the proportion of products with higher gross profit margins.
A lower gross profit margin may be due to the following factors:
(1) Increase in cost of goods sold.
(2) Decrease in selling price.
(3) A combined effect of increase to costs and decrease, in selling price.
(4) Higher proportion of low margin products in the sales mix.
The gross profit ratio is expected to be adequate to cover operating expenses, fixed interest charges, dividends and transfer to reserves.
3. Operating Ratio:
This ratio indicates the relationship between total operating expenses and sales.
Formula:
![]()
Total operating expenses here include cost of goods sold administrative expenses and Selling and distribution expenses. Generally finance expenses like interest are not included under operating expenses.
Net sales mean total sales minus sales returns.
Operating ratio measures the amount of expenditure incurred in production sales and distribution of output. It indicates operational efficiency of the concern. Lower the ratio more is the efficiency. The ratio should be low enough to provide fair return to the shareholders and other investors.
4. Operating Profit Ratio:
It is the ratio of profit made from operating sources to the sales. Usually shown as a percentage. It shows the operational efficiency of the firm and is a measure of the management’s efficiency in running the routine operations of the firm.
Formula:

Operating expenses include administration, selling and distribution expenses. Finance expenses are generally excluded.
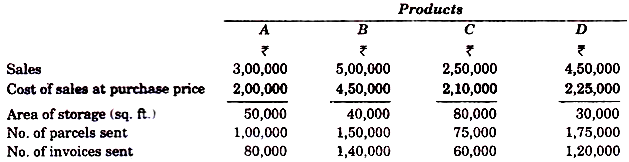
5. Expenses Ratios:
These ratios are also known as supporting ratios to operating ratio. They indicate the efficiency with which business as a whole functions. It is better for the concern to know how it is able to save of waste over expenditure in respect of different items of expenses. Therefore each aspect of cost of sales and operating expenses are analysed.
The formulas for some of the expanses are given below:
Formula:

Note:
Similar ratio also can be calculated for each item of cost, viz., direct material expense ratio, direct wage cost and factory overhead, where each item of cost is the numerator and net sales is the denominator.
6. Net Profit Ratio:
This ratio is also called net profit to sales ratio. It is a measure of management’s efficiency in operating the business successfully from the owner’s point of view. It indicates the return on shareholders’ investments. Higher the ratio better is the operational efficiency of the business concern.
Formula:
![]()
Net profit includes non-operating incomes and profits. Similarly net profit is the profit after reducing non-operating expenses. Provision for tax is also subtracted while determining net profit.
7. Earnings per Share (EPS):
This ratio highlights the overall success of the concern from owners’, point of view and it is helpful in determining market price of equity shares. It reflects upon the capacity of the concern to pay divided to its equity shareholders. The ratio is calculated by dividing the net profit after tax and preference dividend by number of equity shares.
Formula:
![]()
Generally, investors are accustomed to judge companies in the context of the share market, with the help of ‘Earnings per share’.
8. Price Earnings Ratio (P.E.R):
This ratio indicates earnings per share reflected by the market price.
Formula:
![]()
This ratio is of use to prospective investors to decide whether to invest in the equity shares of a company at a particular market price or not.
9. (a) Pay Out Ratio:
This ratio also indirectly throws light on the financial policy of the management in ploughing back.
Formula:

(b) Retained Earnings Ratio:
This ratio shows the proportion of profits retained in the business out of the current year’s profits. In fact the total of the payout ratio and retained earnings ratio should be equal to 100.

Retained earnings are essential for growth and expansion of business. In fact retaining at least 20% of the net profit before declaring any dividend is a statutory requirement.
10. Interest Cover or Fixed Charges Cover:
This ratio establishes the relationship between profit before interest and tax and fixed interest charges.
This ratio is meaningful to debenture-holders and lenders of long-term loans. It highlights the ability of the concern to meet interest commitments and its capacity to raise additional funds in future. Higher the ratio better is the position of long-term creditors and the company’s risk is lesser.
11. Dividend Yield Ratio:
In this ratio the dividend is related to the market value of shares. The result is known as dividend yield.

The ratio is very significant from the view point of those investors who are interested in dividend income.
Turnover Ratios or Activity Ratios:
These ratios are also called performance ratios. Activity ratios highlight the operational efficiency of the business concern. The term operational efficiency refers to effective, profitable and rational use of resources available to the concern. In order to examine the judicious utilisation of resources as well as the wisdom and farsightedness in observing the financial policies laid down in this regard, certain ratios are computed and they are collectively called turnover or activity or performance ratios.
The ratios comprising this category are calculated with reference to sales or cost of sales and expressed in number of times, i.e., rate of turning over or rotation. The activity ratios indicate the briskness with which the business is being carried on. Therefore they are also called ‘velocities’.
Following are various activity ratios.
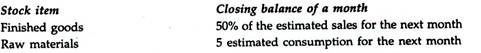
1. (a) Inventory or Stock Turnover Ratio:
This ratio is also called stock velocity ratio. It is calculated to ascertain the efficiency of inventory management in terms of capital investment. It shows the relationship between the cost of goods sold and the amount of average inventory. Stock turnover ratio is obtained by dividing the cost of sales by average stock.
The rationale behind establishing the relationship between cost of sales and average stock is that stock is at the cost price. This ratio is helpful in evaluating and review of inventory policy. It indicates the number of times the inventory is turned over during a particular accounting period.
There are different ways of calculating stock turnover ratio as mentioned below:

The first and the third are mostly in use. The second formula can be used when cost of goods sold is not available. Fourth formula is used to eliminate the effect of changing prices.
Cost of goods sold can be ascertained as mentioned below:
(1) In Case of Trading Concerns:
Cost of goods sold = (Opening stock + Purchases + Direct expenses) – Closing stock
In case of manufacturing concerns:
Cost of goods sold = (Total cost of production + Opening stock of finished goods) —Closing stock of finished goods
Total cost of production = Cost of material consumed + Labour cost + Production overheads
In all situations where gross profit is known:
Cost of goods sold = Sales – Gross profit
Average stock may be taken as the average of stocks at the beginning and end of the accounting period.
![]()
Stock turnover ratio indicates whether the investment in inventory is optimum. The quantity of stock should be enough to meet the requirements of the business but it should not be too excessive which locks up too much capital and may also lead to different types of stock losses.
To judge the efficiency of stock turnover ratio it should be compared over a period of time.
A high inventory ratio indicates efficient inventory management and efficiency of business operations.
(b) Stock Turnover Period (or) Inventory Turnover Period (or) Stock Velocity:
Inventory turnover ratio or stock turnover ratio can be related to ‘time’. The ratio can be expressed in terms of days or months.

The stock velocity of 73 days or 2.4 months conveys that on average every item of stock remains in the store for 73 days or 2.4 months before it is sold or used.
The general objective is to increase the stock velocity as much as possible or in effect decrease the days or months for which items remain in stock.
2. Debtors Turnover Ratio:
Debtors Turnover ratio is also called as receivables turnover ratio or debtors velocity. A business concern generally adopts different methods of sales. One of them is selling on credit. Goods are sold on credit based on credit policy adopted by the firm. The customers who purchase on credit are called trade debtors or book debts. Debtors and bills receivables together are called ‘Accounts receivables’. Some of the customers may be prepared to accept bills for goods purchased on credit. Bills or hundies are termed as bills receivables.
Debtors turnover ratio measures the number of times the receivables are rotated in a year in terms of sales. This ratio also indicates the efficiency of credit collection and efficiency of credit policy. The ratio is helpful in determining the operational efficiency of a business concern and the effectiveness of its credit policy. It is important to maintain a reasonable quantitative relationship between receivables and sales.
Debtors turnover ratio can be calculated as follows:
The objective of this ratio is to measure the liquidity of receivables or obtaining the average period over which receivables are uncollected.
If information relating to credit sales and average debtors is not available, the alternative is to calculate the debtors turnover in terms of the relationship between total sales and closing balance of debtors.
Thus:
![]()
It is to be noted that the first approach to the computation of the debtors turnover is superior. In case of the second approach the effect is that debtors turnover ratio is inflated.
Another approach for measuring the liquidity of a firm’s debtors is the average collection period. This ratio is interrelated to and depends on the debtors turnover ratio.
It can be calculated by any of the following formulae:

The higher the turnover ratio and shorter the average collection period, better is the liquidity of debtors. In other words high turnover ratio and short collection period convey quick payment on the part of debtors. If the turnover ratio is low and the collection period is long, it implies that payments by debtors are delayed.
3. Creditors Turnover Ratio (or) Accounts Payable Turnover:
This ratio is also known as accounts payable or creditors velocity. A business concern usually purchases raw materials, services and goods on credit. The quantum of payables of a business concern depends upon its purchase policy, the quantity of purchases and suppliers’ credit policy. Longer the period of payables outstanding lesser is the problem of working capital of the firm. But if the firm does not pay off its creditors within time, it will adversely affect goodwill of the business.
Creditors turnover ratio indicates the number of times the payables rotate in a year. The term accounts payable includes sundry creditors and bills payable.
Payables turnover indicates the relationship between net purchases for the whole year and total payables.

A higher ratio indicates that creditors are not paid in time. A lower ratio indicates payment of creditors promptly. Depending on the liquidity position of the firm, the kind of payables turnover desirable can be planned.
4. Working Capital Turnover Ratio:
Working capital ratio measures the effective utilisation of working capital. It also measures the smooth running of business or otherwise. The ratio establishes relationship between cost of sales and working capital. Working capital turnover ratio is calculated with the help of the following formula.

Higher sales in comparison to working capital indicate overtrading and a lower sale in comparison to working capital indicates under trading. A higher ratio is the indication of lower investment of working capital and more profit.
5. Fixed Assets Turnover Ratio:
This ratio determines efficiency of utilisation of fixed assets and profitability of a business concern. Higher the ratio, more is the efficiency in utilisation of fixed assets. A lower ratio is the indication of under utilisation of fixed assets.

The former formula which relates the fixed assets to the cost of sales is more popular and preferable.
6. Capital Turnover Ratio:
Managerial efficiency is also calculated by establishing the relationship between cost of sales or sales with the amount of capital invested in the business.
Capital turnover ratio is calculated with the help of the following formula:
Higher ratio indicates higher efficiency and lower ratio indicates ineffective usage of capital.
Solvency or Financial Ratios:
Solvency or Financial ratios include all ratios which express financial position of the concern. Financial ratios are calculated on the basis of items of the Balance Sheet. Therefore, they are also called Balance Sheet ratios. Financial position may mean differently to different, persons interested in the business concern. Creditors, banks, management, investors and auditors have different views about financial position.
The term financial position generally refers to short-term and long-term solvency of the business concern, indicating safety of different interested parties. Financial ratios are also analysed to find judicious use of funds. The significant financial ratios are classified as short-term solvency ratios and long-term solvency ratios.
Therefore financial ratios are as under:
(1) Overall solvency
(2) Short-term solvency (or) Liquidity ratios
(i) Current ratio
(ii) Liquid ratio
(iii) Cash position ratio
(3) Long-term solvency ratios-
(i) Fixed assets ratio
(ii) Debt equity ratio
(iii) Proprietary ratio, and
(iv) Capital gearing ratio.
1. Overall Solvency (or) Total Debt (or) Debt Ratio:
It is a ratio which relates the total tangible assets with the total borrowed funds. In a sense, it is the ‘other side of the coin’ for proprietary ratio.
In this ratio, total debt includes both short-term and long-term borrowings. It shows the proportion of assets needed to repay the debts. A higher ratio indicates greater risk and lower safety to the owners. A higher ratio also makes the firm vulnerable’ to business cycles and its solvency becomes suspect. Further borrowing becomes difficult for firms with a high total debt ratio. Such firms are called ‘Highly geared’.
2. Short-Term Solvency Ratios:
(i) Current Ratio:
The ratio of current assets to current liabilities is called ‘current ratio’. In order to measure the short-term liquidity or solvency of a concern, comparison of current assets and current liabilities is inevitable. Current ratio indicates the ability of a concern to meet its current obligations as and when they are due for payment.
![]()
The term current assets includes debtors, stock, bills receivables, bank and cash balances, prepaid expenses, income due and short-term investments.
The term current liabilities includes creditors, bank overdraft, bills payable, outstanding expenses, income received in advance, etc.
Standard Expected Current Ratio:
Internationally accepted current ratio is 2 :1 i.e., current assets shall be 2 times to current liabilities.
The business concern will be able to meet its current obligations easily with such a ratio between its current assets and liabilities. The ability of the concern also depends on composition of current assets. If current assets have more of stock, debtors, other than cash and bank, it may be difficult to meet current obligations. But at the same time most of the current assets consist of bank and cash, it is easier to meet the obligations.
A very high current ratio also does not indicate efficiency since it means less efficient use of funds. A high current ratio also indicates dependence on long-term sources of raising funds. Long-term funds are more expensive than current liabilities. A ratio of less than 2 indicates inadequate current assets to meet current liabilities. Ideal ratio of ‘2’ is insisted because even if current assets are reduced to half i.e., ‘1’ instead of ‘2’, creditors will be able to get their dues in full. The difference between the current assets and current liabilities acts as ‘cushion’ and provides flexibility for payments.
(ii) Liquid Ratio:
This ratio is also called ‘Quick’ or ‘Acid test’ ratio. It is calculated by comparing the quick assets with current liabilities.

Quick or liquid assets refer to assets which are quickly convertible into cash. Current assets other than stock and prepaid expenses are considered as quick assets.
The ideal liquid ratio or the generally accepted ‘norm’ for liquid ratio is ‘1’.
Comparison of quick ratio with current ratio indicates the inventory hold ups.
(iii) Cash Position Ratio:
This ratio is also called ‘Absolute Liquidity ratio’ or ‘super quick ratio’. This is a variation of quick ratio. This ratio is calculated when liquidity is highly restricted in terms of cash and cash equivalents. This ratio measures liquidity in terms of cash and near cash items and short-term current liabilities.
Cash position ratio is calculated with the help of the following formula-

3. Long-Term Solvency Ratios:
(1) Fixed Assets Ratio:
The ratio establishes the relationship between fixed assets and long-term funds. The objective of calculating this ratio is to ascertain the proportion of long-term funds invested in fixed assets.
The ratio is calculated as given below:
The ratio should not generally be more than ‘1’. If the ratio is less than one it indicates that a portion of working capital has been financed by long-term funds. It is desirable in that part of working capital is core working capital and it is more or less a fixed item.
An ideal fixed assets ratio is 0.67.
Fixed assets ratio of more than ‘1’ implies that fixed assets are purchased with short-term funds, which is not a prudent policy.
Fixed assets here mean = Fixed assets – Depreciation
Long-term funds = Share capital + Reserves and surplus + Long-term loans – Fictitious assets
(2) Debt Equity Ratio:
This ratio is ascertained to determine long-term solvency position of a company. Debt equity ratio is also called ‘external-internal equity ratio’.
The third formula which shows the long-term borrowings as a proportion of owners’ funds is the most popular one.
(3) Proprietary Ratio:
This ratio compares the shareholders’ funds or owner’s funds and total tangible assets. In other words this ratio expresses the relationship between the proprietor’s funds and the total tangible assets.
This ratio shows the general soundness of the company. It is of particular interest to the creditors of the company as it helps them to ascertain the shareholders’ funds in the total assets of the business. A high ratio indicates safety to the creditors and a low ratio shows greater risk to the creditors.
A ratio below 5 is alarming for the creditors since they have to lose heavily in the event of company’s liquidation as it indicates more of creditors funds and less of shareholders’ funds in the total assets of the company.
(4) Capital Gearing Ratio:
This ratio is also known as capitalisation or leverage ratio. It is also one of the long-term solvency ratios. It is used to analyse the capital structure of the company. The ratio establishes relationship between fixed interest and dividend bearing funds and equity shareholders’ funds.
The capital gearing ratio is calculated with the help of the following formula-
Capital gearing ratio shows the proportion of various items of long-term finance employed in the business. Its main emphasis is on indication of the proportion between owners’ funds and non-owners’ funds. This proportion is called leverage. If the ratio is high, the capital gearing is said to be high and if the ratio is low the capital gearing is said to be low. The implication is that high gearing is ‘Trading on Thin Equity’ and low gearing is ‘Trading on Thick Equity.’
Further, highly geared capital structure is the indication for under capitalisation which means that amount of capital is disproportionate to the needs measured by the volume of activity. A low gearing ratio indicates over capitalisation. The aim should be to avoid both high gearing and low gearing and achieve ‘Fair capitalisation’.