
Read this essay to learn about:- 1. Introduction to Standard Costing and Variance Analysis 2. Standard Cost Versus Target Cost 3. Meaning of Standard Costs 4. Standard Cost Versus Target Cost 5. Locked-In-Costs 6. Material Standards and Variance Analysis.
Essay # 1. Introduction to Standard Costing and Variance Analysis:
Standard costs are building block of planning and control system. Standards are the expected level of performance which are established with reference to given resources both physical and human, and functional structure. Standards should not be set at ideal level. If they are set on the basis of existing resources and functional structure, then only they work as targets which can be achieved.
For example, the production cost standard should be set considering the existing production processes and product design and material specification. Labour and overhead costs requirement should be standardised accordingly. Standards should be set with reference to competitors’ production cost.
Standard costs are always based on existing situation. If the existing functional structure is further rationalized, then it is possible to set new standards.
Essay # 2. Standard Cost Versus Target Cost:
ADVERTISEMENTS:
The difference between target price and reasonable profit is termed as target cost. Target price is determined by the market price. This is a price which the potential customers are willing to pay for the product. Target price is determined by customers’ value perception.
In a competitive economy, the customers cannot be taken as granted. Cost plus profit can no longer be the pricing formula. Costs no longer determine price, rather price determines cost.
Thus relevance for standard costs to achieve competitiveness is doubtful. Standard costs can control costs to the extent possible within the existing operational framework, but it is not a technique to achieve the target cost.
Essay # 3. Meaning of Standard Costs:
Standard costs are building block of planning and control system. Standards are the expected level of performance which are established with reference to given resources both physical and human, and functional structure. Standards should not be set at ideal level. If they are set on the basis of existing resources and functional structure, then only they work as targets which can be achieved.
ADVERTISEMENTS:
For example, the production cost standard should be set considering the existing production processes and product design and material specification. Labour and overhead costs requirement should be standardised accordingly. Standards should be set with reference to competitors’ production cost.
Standard costs are always based on existing situation. If the existing functional structure is further rationalized, then it is possible to set new standards.
Essay # 4. Standard Cost Versus Target Cost:
The difference between target price and reasonable profit is termed as target cost. Target price is determined by the market price. This is a price which the potential customers are willing to pay for the product. Target price is determined by customers’ value perception.
In a competitive economy, the customers cannot be taken as granted. Cost plus profit can no longer be the pricing formula. Costs no longer determine price, rather price determines cost.
ADVERTISEMENTS:
Thus relevance for standard costs to achieve competitiveness is doubtful. Standard costs can control costs to the extent possible within the existing operational framework, but it is not a technique to achieve the target cost.
Essay # 5. Locked-In-Costs:
In production situation, costs are locked-in at the designing stage. Product designs dictates the material, labour and overheads costs. This means a substantial amount of costs are locked-in-costs in designing stage, which can not be reduced at a later stage. Change in product design may reduce components, material costs, labour cost and overheads. Change in product design and its impact on use value of the product needs to be studied for achieving target cost.
Essay # 6. Material Standards and Variance Analysis:
It is predetermined at the designed stage. Now material standards are set with reference to material requirement as per design specification and prevailing price.
Factors to be considered for setting standards are:
ADVERTISEMENTS:
a) Product Design;
b) Various items of material;
c) Input-output ratio; and
d) Prevailing market price.
ADVERTISEMENTS:
Analysis of Material Cost Variance:
Usefulness of every standard depends on comparison of the standard with actuals. Difference between standard and actual is termed as variance.
Let us take an example. A factory produces 800 units of product X. Standard cost of material consumption is 1000 units @ Rs.100 p.u. Actual material consumption is 1100 units @ Rs.110.
Total material cost variance is given by:
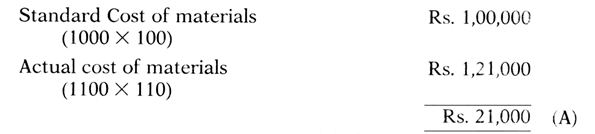
‘A’ stands for adverse variance. ‘F’ stands for favourable variance. This variance is adverse because actual cost is higher than the standard.
Total material cost variance can be further analysed into price variance and quantity variance:

Price Variance = Actual quantity consumed × (Standard price or Actual Price)
ADVERTISEMENTS:
= 1100 × (100 ~ 110) = Rs.11000 (A)
Adverse price variance results when actual price is more than standard price.
Usage Variance = Standard Price × (Standard Quantity ~ Actual Quantity)
= 100 × (1000 ~ 1100)
= Rs. 10,000 (A)
Adverse quantity variance results when actual quantity consumed for a given level of output is more than that of the standard.
ADVERTISEMENTS:
Total Material Cost Variance = Price Variance + Usage Variance
Rs. 21,000 (A) = Rs. 11,000 (A) + Rs. 10,000 (A).
Quantity variance can also be calculated looking into the yield variance.
Continuing with the example:
![]()
![]()
Standard yield for actual material consumption:
![]()
Actual output 800 units
Abnormal loss (880 units – 800 units) = 80 units
Yield Variance = 80 × Rs.125 = Rs.10, 000 (A).
Illustration 1:
On material variance analysis:
Given below raw material standard for producing 10000 Kg. of Product A and actual raw material consumption. Prepare a statement of Material Cost Variance.

Solution:
Statement of Material cost Variance:
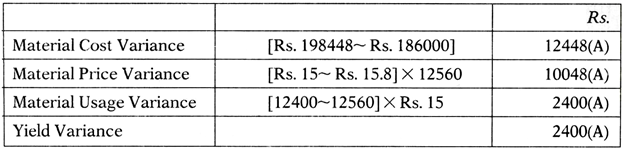
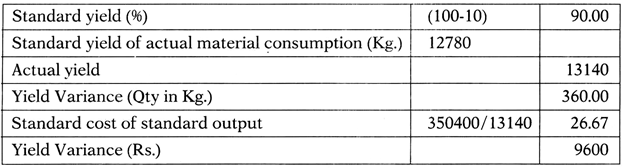
Note on Yield variance Calculation:

Illustration 2:
Given material standard of a product. Prepare a statement of material cost variance showing separately yield variance.

Solution:
Statement of Material Cost Variance:

Note on Calculation of Yield Variance:
Mix Variance:
If the final output has been designed on the basis of prescribed material mix and in the actual production process that standard mix varies, the resultant cost variance is termed as mix variance.
If there exists mix variance material cost variance analysis is reclassified as shown below:


Let us quantify mix variance using an example:
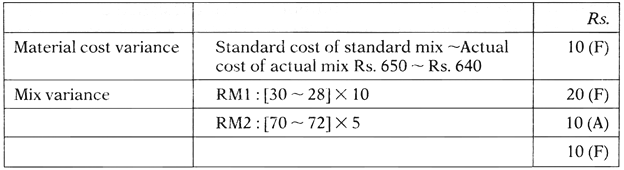
Material standard for producing 100 Kg of Product A was – RM130 Kg. @ Rs.10 & RM2 70 Kg. @ Rs.5. Actual material consumption was – RM1 28 Kg. @ Rs.10 and RM2 72 Kg. @ Rs.5. In this example, price per Kg. of RM1 and RM2 remained the same. Output remained the same. So there was no price and yield variance. There was only Mix Variance.

What is the actual cost?

Now let us analyse the variances:
Statement of Material Variance Analysis:
Illustrating Price, Mix and Yield variance:
Now we may step by step develop price variance, mix variance and yield variance. Firstly, price variance and mix variance are discussed.
With same standard of RM1 and RM2, let us take a different actual mix data:
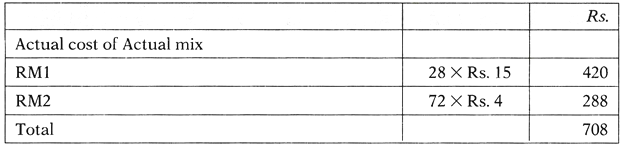
In a material mix situation, Price variance is the difference between Standard Cost of Actual Mix and Actual Cost of Actual Mix.
Price variance = Standard Cost of Actual Mix ~ Actual Cost of Actual Mix
Price Variance Analysis in a Material Mix Situation:

Column (4) = Standard Cost of Actual Mix (SCAM), Column (7) = Actual Cost of Actual Mix (ACAM)
With this actual mix data material cost variance, price variance and mix variance would be as follows:

Now let us consider price, mix and yield factors together. With the same standard let us take the following actual data:
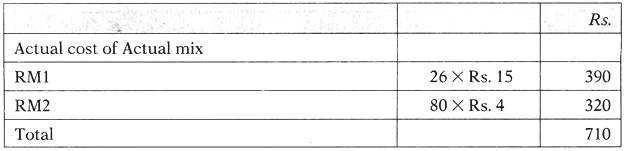
Here total quantity consumed has been changed from that of the standard. Interchanging RM1 and RM2 has created yield variance. More quantity of raw material has been consumed for production of the same output. Thus there is a yield variance.
What is the received standard for the actual quantity consumed as per the standard mix?

The difference between Standard Cost of Standard Mix and Standard Cost of Actual Mix in standard proportion is yield variance.
Actual material consumption (106 Kg.) is distributed in the standard mix ratio to get actual mix in standard proportion:
![]()
![]()
As per the standard, consumption of raw material should be RM1 = 30 Kg. and RM2 = 70 Kg. The excess material consumption is for yield variance. This is evaluated applying standard rate.
For the measurement of price variance it is important to understand the standard cost of actual mix:

Any difference in raw material consumption with the standard mix of actual material consumption causes mix variance. This is evaluated in terms of standard cost.
Statement of Material Cost Variance:

Essay # 7. Labour Cost Standards and Variance Analysis:
Likewise material cost standards, it is essential to fix up labour cost standards. While fixing up the labour standards, firstly group is formed consisting of skilled and unskilled labour. Then standard labour hours required for both skilled and unskilled labours are determined. Labour standard is thus set per unit of output.
Analysis of Labour Cost Variance:
Difference between standard labour cost for a given level of output and actual labour cost is termed as total labour cost variance.
Various components of labour cost variance are:
i. Rate Variance:
This arises because of wages;
ii. Efficiency Variance:
This arises because of consumption of more labour hours as compared to the standard.
Let us take an example:
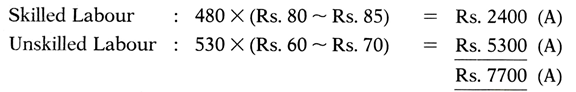
To produce 1000 units, it is necessary to have 500 skilled labour hours and 500 unskilled labour hours. Hourly rate per skilled labour is Rs.80 and per unskilled labour is Rs.60. But actual consumption of skilled labour hours was 480 @ Rs.85 p.h. and 530 unskilled labour hours @ Rs 70.
Thus Total labour cost variance is given by:-
Standard Labour Cost:
Actual Labour Cost:

Labour Rate Variance is given by:—
Actual Labour Hours × (Standard Rate – Actual Rate)
Continuing with the example, rate variance may be worked out as follows:—
Labour Efficiency Variance is given by:—
Standard Labour Rate × (Standard labour Hours ~ Actual labour Hours)
Continuing with the example efficiency variance may be worked out as follows:—
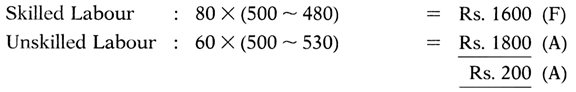
“F” stands for Favourable variance. When actual rate or consumption becomes less than the standard, favourable variance arises.
Efficiency variance can be further analysed into idle time variance and group variance. From this example, it is clear that actual groups of skilled and unskilled labourers were different. Skilled and unskilled labour hours were not in equal proportion, because of that inefficiency has crept into. Also there may arise idle time because of waiting for materials, machine set up or instructions which is higher than the normally expected waiting time.
Continuing with the example, let us assume that idle time is 30 hours of which 12 hours were of skilled workers and 18 hours of unskilled workers.
Then idle time variance is given by:
Idle labour hours × Standard Rate.

Group Variance is found by eliminating idle time from actual labour hours applying standard rate.
Continuing with the example, group variance may be computed as follows:
Illustration 3:
It requires 500 labour hours to produce 500 units. Rate per labour hour is Rs.20 to produce 500 hours actually 498 hours were taken including 6 hours of idle time and actual wage payment was Rs.10,956. Find out labour cost variances.
Solution:

Essay # 8. Overhead Standard and Variance Analysis:
Overhead standards are set with reference to variable overhead and fixed overhead separately. Variances are also analysed separately.
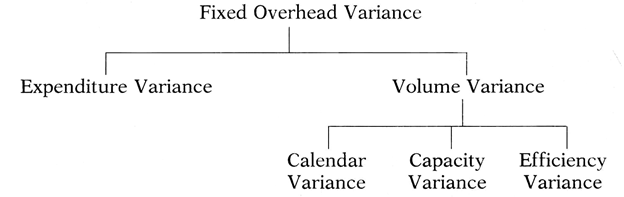
Variable overhead variance is segregated into expenditure variance and efficiency variance. On the other hand, fixed overhead variance is segregated into expenditure variance and volume variance. Volume variance is further segregated into calendar variance, capacity variance and efficiency variance.
Analysis of Variable Overhead Variance – Variable overhead variance is analysed as follows:

![]()
Let us now calculate three parameters:
(A) Standard overhead consumption for actual production at standard rate:Rs.1,00,000(1000 × 10 × 10)
(B) Actual overhead consumption for actual production at standard rate :Rs.1,10,000(1000 × 11 × Rs.10)
(C) Actual variable overhead: Rs. 1,1500
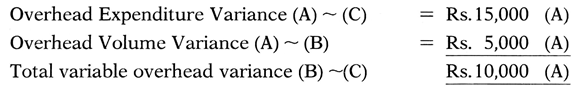
Illustration 4:
To produce 500 units 1000 machine hours are required. Standard variable overhead is Rs.4 per machine hour. Actual variable overhead is Rs.4200 and actual machine hour utilisation is 990. Analyse variable overhead variances.
Solution:

Analysis of Fixed Overhead Variance:
Fixed overhead variance is analysed as follows:
Let us take figures to illustrate the concept:


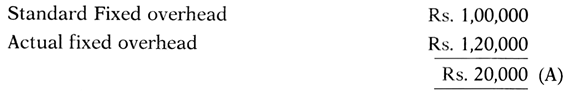
Fixed overhead variance:

Expenditure variances:
This is given by the differences between standard fixed overhead and actual fixed overhead incurred:
Volume variance:
This is given by the difference between standard fixed overhead and standard fixed overhead and standard fixed overhead allowance for actual production:
Volume variance is segregated into calendar variance ,capacity variances and efficiency variance.
Calendar variance:
This arises because of variation of actual working days.
Capacity Variance:
This arises because of variation of total working hours.
![]()
Calender Variance + Capacity Variance + Efficiency Variance
= Rs. 4000 (A) + Rs. 2400 (A) + Rs. 9,360 (A)
= Rs. 15,760 (A)
Sales variance is the difference between standard sales and actual sales. It is classified into two components – price variance and quantity variance. If the standard sales are less than actual sales, it is favourable variance and if the actual sales are less than the standard sales is adverse variance.
Illustration 5:
A company has set sales standard at 1000 units (g Rs. 10 per unit. Actual sales of 980 units resulted in sales volume of Rs. 10780. Analyse the sales variance.
Solution:
Sales Variance = [Actual sales ~ Standard Sales] = [Rs. 10780- Rs. 1000 X 10] = Rs. 780 (F)
Actual selling price = Rs. 10780/980 = Rs.l 1 per unit.
Price variance = [Actual quantity sold X Price difference] = 980 X (11—10) = Rs. 980 (F)
Quantity Variance = Standard selling price X Quantity variance = Rs. 10 X [980-1000] = Rs. 200 (A)
This shows that –
Sales variance = Price variance + Quantity Variance. Flexible Budget variances
When the level of performance changes the reference point for variance analysis is changed. Flexible budget represents the new standard. The difference arises because of shift in standard is termed as flexible budget variance.
Given below is the budget of Deccan Wires and cables Ltd. which was prepared for 50% capacity level. However, the company operated at 60% capacity level.

You are required to calculate profit variance and explain the reasons thereof.
Solution:

(1) Profit Variance Analysis:

(2) Sales Variances:
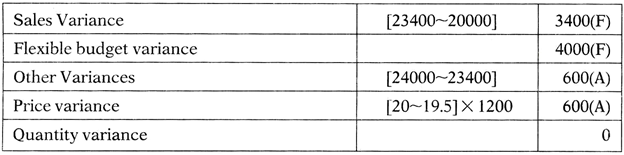
(3) Material Variance Analysis:

(4) Labour Variance Analysis:

(5) Variable Overhead Variance Analysis:

(6) Fixed Overhead Variances Analysis:

Statements of Variances Analysis:
