
Control techniques can be studied under: A. Traditional Techniques B. Modern Techniques.
Traditional techniques of controlling includes: 1. Budgetary Control 2. Standard Costing 3. Financial Ratio Analysis 4. Internal Audit 5. Statistical Control 6. Break-Even Point Analysis 7. Personal Observation 8. Financial Ratio Analysis 9. Internal Audit.
Modern techniques of controlling includes: 1. Network Techniques (PERT and CPM) 2. Management Information System (MIS) 3. Ratio Analysis 4. Economic Value Added (EVA) 5. Market Value Added (MVA) 6. Zero base budgeting 7. Management audit 8. Network Appraisal 9. Stakeholders Approach (Balanced Scorecard) 10. Accounting Measures (Integrated Ratio Analysis).
Control Techniques: Traditional and Modern Controlling Techniques of Controlling as studied in Management
Control Techniques: Budgetary Control Techniques, Personal or Direct Supervision Techniques, Break-Even Analysis and Statistical Reports
Controlling, being an essential pre-requisite for effective functioning of an organisation, requires to be carried out very carefully. With loose or casual control mechanism, an organisation may land up in the state of chaos and inefficiency whereas a very strict and tight control mechanism may choke up the creativity and innovation.
ADVERTISEMENTS:
Thus, in order to bring desired results, i.e., analysing the variances in actual and planned performance and thereby taking a corrective measure, an appropriate control, i.e., neither too strict nor too loose mechanism is imperative.
Control mechanism may have different connotations depending upon the context in which it is used. For example, in factories and processing units, control mechanism may be a device or an apparatus installed to guard the quality, quantity, operational efficiency, etc.
In legal system, control mechanism may be execution and implementation of certain laws whereas in management, it may be a cluster of activities or indicators which governs the functioning of organisational personnel. These control mechanisms are called control techniques.
Broadly speaking, in management, control techniques are categorised in two heads:
A. Traditional Techniques:
ADVERTISEMENTS:
One of the oldest control techniques and still widely used is the budgetary control. According to J. Batty, “budgetary control is a system which uses budget as a means of planning and controlling all aspects of producing and/or selling commodities and services.”
A more comprehensive definition is given by Brown and Howard, “Budgetary control is a system of controlling costs which includes the preparation of budgets, coordinating the departments and establishing responsibilities, comparing actual performance with the budgeted and acting upon results to achieve maximum profitability.” Budgetary control is a managerial control technique through preparation of various budgets.
Thus, budgetary control follows the following steps:
ADVERTISEMENTS:
(i) Preparation of budgets
(ii) Continuous comparison of actual performance with the budgets
(iii) Taking corrective actions
(iv) Revising the budgets with change in circumstances
ADVERTISEMENTS:
Objectives of Budgetary Control:
i. Achievement of Organisation Goals:
Budgets are prepared within the broad framework of organisational objectives. They are the sub-plans which breaks the broad vague objectives into specific operational target plans. With budgeting; an organisation may be sure of achieving overall organisational objectives.
ii. Effective Coordination:
ADVERTISEMENTS:
Budgeting is an important tool for establishing coordination and integration among various departments. With the help of budgets, one department comes to know about expectations and targets of another department which may be used to synchronise the activities for smooth functioning. For example, a sales budget would tell the production department how much sales are expected for a given period and may accordingly adjust their production schedule.
iii. Optimum Utilisation of Resources:
Budgets ensure allocation of resources according to the needs and requirements of various units. With budgeting, arbitrary allocation of resources is restricted and thus, optimal utilisation of resources is safeguarded.
iv. Effective Control:
ADVERTISEMENTS:
With budgets prepared for every department and various units of each department, it acts as a strong control technique by providing a standard to be achieved and later on provides a basis for comparing actual performance with these standards.
v. Clarity of Operations:
Budgets by explicitly mentioning the targets to be achieved and the time period within which they are to be achieved, brings clarity and precision in operations. With budgeting, accountability and responsibility of each individual is fixed so that each one knows what is expected of him.
Types of Budgets:
ADVERTISEMENTS:
Budgets are quantitative statements prepared for a given period of time beforehand which provides a base for comparison of actual performance during that period. Thus, budgets are an important source of control as it provides a benchmark to be achieved through actual performance and later a standard to evaluate the same. Depending on the nature and purpose, an organisation may have an array of budgets.
Although it is not possible to give an exhaustive list of budgets, but the most common categories of budgets prepared by an organisation are as follows:
i. Master Budget and Operating Budget:
Master Budget:
It is an overall comprehensive budget catering to the goals and objectives of overall organisation. It is normally an aggregate of individual budgets prepared by various functional areas of an organisation. It combines areas like sales, production, income, assets, cash budget, etc., to give the holistic status and health of an organisation.
Operating Budget:
ADVERTISEMENTS:
Operating budgets are sub-budgets which are created for giving direct targets to various functional departments. These budgets act as guidelines and benchmarks for action. These are specific budgets and are prepared for relatively smaller period of time say weekly or monthly budgets.
Operating budgets may be:
a. Sales budget – Gives an estimate of total sales expected in a given period of time expressed in terms of rupees and quantities.
b. Production budget – Gives an estimate of production output expected in a budget period.
c. Material budget – Budget of expected quantity and cost of material required for production.
d. Direct expenses budget – It gives an estimate of type and quantum of various costs involved in maintenance, promotion and distribution of finished goods.
e. Overhead budget – Gives an estimate of various administrative and indirect expenses over a budgeted period.
f. Cash budget – Gives an estimate of expected inflow and outflow of cash during the budgeted period. It is prepared to ensure availability of ready cash to meet the organisational commitments.
ii. Financial Budget:
Financial budgets are plans of income and expenses level in an organisation. These plans may be made on both long-term and short-term basis. It primarily aims at depicting the portrait of financial health of a company. Financial budget basically acts as an input for all the functional areas to decide the scope of their operations.
iii. Static and Flexible Budget:
Static budget – A static budget is a fixed budget that remains unaltered regardless of changes in factors such as sales volume or revenue. These budgets are prepared for a fixed level of activity and primarily aim at coordinating sectional activities.
Flexible budget – Flexible budget is a budget which changes with the change in the activity or sales level. In other words, a flexible budget is normally prepared for different levels of activities so as to show the changes occurring due to change in the sales level.
Zero Base Budgeting:
Zero base budgeting (ZBB) is a method of budgeting from scratch for every budgeting period. This type of budgeting is based on a premise that every budgeting period is different and should be dealt with in a total disjoint manner. Thus, it involves preparing the budget with a zero base. Hence, zero base budgeting may be defined as a method of budgeting in which all the expenses for the new period are calculated on the basis of actual expenses that are to be incurred and not on the incremental basis.
Under this method, every activity needs to be justified, explaining the revenue that every cost will generate for the company during a particular budget period. Contrary to the traditional method of budgeting in which past trends or past sales/expenditure are expected to continue, zero base budgeting assumes that there are no balances to-be-carried forward or there are no expenses that are pre-committed.
2. Personal Observation:
Personal or direct supervision is one of the oldest techniques of controlling. Under this method, supervisor either himself or through a designated authority observes the employees and collects firsthand information about their performance.
This technique acts as a great tool of controlling as being observed every time puts a psychological pressure on the employees which restricts them from deviating from work. Moreover, this technique reduces a lot of paperwork and is faster in terms of remedial measures. However, such a technique is subjective and may be affected by personal bias and prejudices of the supervisor.
Break-even analysis helps in identifying that volume of sales at which a company is neither earning any profit nor is incurring any loss, i.e., the level at which revenue exactly equals the total cost. This is called as break-even point. Break-even analysis helps management in establishing a relationship between sales, costs and revenues.
With break-even analysis, an organisation would be able to determine the probable profit at different levels of sales. It enables the management to identify that level of production beyond which it will start fetching profit or that level below which it will incur losses. Thus, it helps in deciding the appropriate level of production.
A break-even point is depicted in the following diagram:

From the above diagram, it can be observed that the company will have a break-even point at 60,000 units.
With the help of this information, a company can control and decide upon the following aspects:
i. Ensure that production is sufficient to meet the profit target.
ii. Keep an eye on the production so that it should not fall below 60,000 so that company starts incurring losses.
iii. Can exercise cost control at various level of sales.
4. Statistical Reports:
A statistical report is a form of systematic presentation of numeric or quantitative information. Statistical reports may be in the form of tables, graphs, comparative sheets, charts, etc. These reports provide information in a manner which can be easily analysed and can be used to evaluate employees’ performance.
Such numeric reports are very helpful for various types of comparisons such as across time, amongst employees, amongst organisations, etc. With the help of various statistical tools and techniques, a data set may be used to arrive at many meaningful interpretations such as averages, regressions, variances, etc.
B. Modern Techniques:
1. Network Techniques (PERT and CPM):
Network techniques are widely used as control methods in project management. A project may be defined as a big venture which comprises of many interconnected, interdependent and sequential activities. For the purpose of ensuring timely and successful completion of the project, a network analysis is carried out. Thus, a network analysis aims at planning, organising and controlling of various activities so as to complete the project in an effective and efficient manner.
The projects, in general, have the following objectives to be fulfilled:
i. Should be completed without delay,
ii. Optimisation of resources,
iii. Completion at least possible cost.
Network analysis attempts to attain all the above three objectives of projects through drawing and analysing the networks. Network may be defined as a symbolic presentation of combination of interrelated activities which must be executed in a certain order in least possible time. They represent sequential activities in a form of a single flow chart starting with the first activity and ending with the last and in between showing interdependence among activities.
Following diagram is a specimen of a network diagram:

Most Commonly Used Network Techniques – PERT and CPM:
The CPM was first developed in 1950s by DuPont, and was used in missile-defense construction projects. Critical path method is a deterministic step by step technique for project management that defines critical and non-critical activities so as to enable the project completion in minimum possible time and to prevent the operational problems and process bottlenecks. The CPM is ideally suited and adopted for projects consisting of numerous activities interacting in a complex manner and for which time and costs are certainly and precisely known.
For implementing CPM, steps to be adopted are summarised as follows:
i. Delineate the entire project into smaller tasks or activities and state them in an ordered (sequenced) list.
ii. Create a flowchart or a network showing each activity with specific preceding, concurrent and succeeding activities in relation to the each other.
iii. Identify the critical path, i.e., the most crucial path and non-critical paths of various activities.
iv. Determine the expected completion time for each activity and then the expected completion time for the entire project.
v. Identify the flexibility in operations, i.e., possibility of reshuffling of resources so as to focus more on activities on critical path.
Programme Evaluation Review Technique (PERT):
PERT is a probabilistic technique of project management. This technique was first used in 1957 in USA in naval department as a tool for planning and control of the “Polaris Missiles Programme”. Unlike critical path method, in PERT, time duration of each activity is no longer a single-time estimate which is precisely known with certainty.
Time is a random variable characterised by a probability distribution and three time estimates are given which are:
i. Optimistic time estimate (t0)
ii. Pessimistic time estimate (tp)
iii. Most likely time estimate (tm)
Based on these three time estimates, expected or average time for each activity is calculated with the help of the following formula:
![]()
2. Management Information System (MIS):
MIS is a computer-based information system of collecting, storing and disseminating data in the form of information needed by supervisors at various levels. It helps the managers to discharge their functions of management efficiently and effectively. MIS is a mechanism which ensures up-to-date information transfer at the right time and at the right pace so that it can be used by the managers to take decisions.
With MIS, the quality of management enhances as it provides accurate, timely and relevant information necessary for planning, organisation and control. According to Walter Kennevan, “MIS is a formal method of collecting timely information in a presentable form in order to facilitate effective decision-making and implementation, in order to carry out organisational operations for the purpose of achieving the organisational goals.”
Significance of MIS:
In the recent years, the need for management information system has increased manifold due to the following reasons:
i. Fosters Effective Planning – MIS is very useful for efficient and effective planning function of an organisation. MIS by providing quick and timely information to the management will be instrumental in developing plans more accurately and swiftly.
ii. Faster Communication – Management information system, with the computer-based information system and usage of advanced techniques of information transfer, ensures that information reaches the right person at the right time. With MIS, the formal communication becomes fast and accurate.
iii. Globalisation and Reducing Cultural Gap – With the implementation of computer-based information system in organisations, one can scale down the problems arising from the linguistic, geographical and some cultural diversities. With MIS, sharing of information, knowledge, communicating and building relationships between different countries becomes much easier.
iv. Availability – Management information systems have made it possible for businesses to be open 24×7 across the globe. This means that a business can be open anytime and anywhere making trade between different countries easier and more convenient.
v. Cost-Effectiveness and Productivity – The MIS application promotes more efficient operation of the company and also improves the supply of information to decision-makers. Applying such systems can also play an important role in helping companies to put greater emphasis on information technology in order to gain a competitive advantage.
vi. Effective Means of Control – MIS is instrumental in generation of various kinds of reports indicating about the performance of men, materials, machinery, money and management. MIS is helpful in controlling costs by giving information about idle time, labour turnover, wastages and losses and surplus capacity. Furthermore, MIS makes comparison of actual performance with the standard and budgeted performance very promptly, enabling mangers to take remedial actions in no time.
Ratio analysis is a useful technique for judging the efficiency of an organisation through analysis and interpretation of financial statements. Absolute values of financial statements do not reveal the true financial picture and thus are not reliable for taking managerial decisions and exercising control. Ratios by establishing relationships between two or more values attempt to derive relevant meaning from financial statements.
These ratios being indicators of actual performance also serves as a measure of control by providing base of comparison with standards. However, ratio analysis is not an end in itself. It is only a means of better understanding of financial strengths and weaknesses of a firm. Ratios may be treated as symptoms from which financial health of an organisation may be gauged.
Ratio analysis is carried out in the following order:
i. Identification and selection of data depending upon the objective of the analysis.
ii. Selection and calculation of appropriate ratios from the above data.
iii. Comparison of the calculated ratios with the ratios of the same firm in the past, or with the standard ratios.
iv. Interpretation of the ratios and making suggestions.
Types of Ratios:
Depending upon the purpose for which they are calculated and information that they provide, ratios can be divided into following categories:
i. Liquidity Ratios:
These ratios provide information on a firm’s ability to meet its short-term financial obligations. These ratios are helpful for the company to identify its liquidity position and to those lenders who wish to lend for the short term.
Following are the ratios calculated in this category:
(a) Current ratio
(b) Quick ratio
(c) Cash ratio.
ii. Profitability Ratios:
These ratios, as the name indicates, communicate about the profitability of the firm. Profitability means the ability of a company to convert sales into rupees and cash flow. The term profit may be interpreted in different ways and thus there are different profitability ratios as well.
Following are the ratios:
(a) Gross profit ratio
(b) Net profit ratio
(c) Return on assets
(d) Return on equity
(e) Return on investment
(f) Return on capital employed.
iii. Leverage/Solvency Ratios:
Solvency ratios indicate financial stability of the company as it measures a company’s debt relative to its assets and equity. A company with too much debt may not have the flexibility to manage its cash flow if interest rates rise or if business conditions deteriorate.
The common solvency ratios are:
(a) Debt to assets ratio
(b) Debt equity ratio
iv. Efficiency Ratios:
Efficiency ratios indicate how efficiently a company uses its resources and converts them into sales. These ratios are commonly termed as turnover ratios.
These are:
(a) Asset turnover ratios
(b) Inventory turnover ratio
(c) Accounts receivables turnover ratio.
v. Market Value Ratios:
These ratios indicate the value created by company for its shareholders. These ratios are comparative ratios of performance of a company vis-a-vis market.
These include:
(a) Price earnings ratio
(b) Dividend payout ratio
(c) Market to book ratio
(d) Dividend yield ratio.
i. Aids in Decision-Making:
Financial statement per se reveals the financial status of the company but fails to give any indication of its financial strengths and weaknesses. For example, a capital of Rs. 100 crore is information but not sufficient enough to take any decision or derive meaning out of it. Ratio analysis helps in deriving meaning from the financial statements and henceforth taking rational decisions.
ii. Source of Information:
Ratios provide meaningful information to various stakeholders of the company. As many people invest their money (investors), material (suppliers), knowledge and time (manpower), they wish to see the relevant performance of the company.
For example, investors would like to know return on their investment, return on their equity, etc. All this information is provided by ratio analysis.
iii. Helps in Financial Forecasting and Planning:
Ratio Analysis also helps in financial forecasting and planning. Planning is looking ahead and the ratios calculated in previous years act as a guide for setting future targets. Meaningful conclusions can be drawn for future from these ratios. Thus, ratio analysis helps in forecasting and planning.
iv. A Tool for Communication:
Ratios are able to communicate the financial strength and weakness of a firm in a more easy and understandable manner. Each ratio has a specific purpose and meaning and thus a single ratio may give detailed information. Thus, ratios help in communication and enhance the value of the financial statements.
v. Used as a Control Technique:
Ratio analysis is used as a strong tool for effective financial control of an organisation. Ratios are the indicators of actual performance for the year for which they are calculated. These can be compared with the ratios of the previous years of the same firm or with some standard ratios set for the industry or in general. As an outcome of comparison, the ratios may reveal the current financial health of the company aiding the company to take relevant remedial actions.
4. Economic Value Added (EVA):
Economic value added (EVA) is an internal management performance measure of a company’s financial performance based on the residual wealth calculated by deducting its cost of capital from its operating profit, adjusted for taxes on a cash basis. EVA can also be referred to as economic profit, and it attempts to capture the true economic profit of a company.
EVA is calculated with the help of the following formula:
EVA = Net Operating Profit after Tax (NOPAT) – [Invested Capital x Weighted Average Cost of Capital (WACC)]
The above formula shows that there are three main components to compute a company’s EVA.
These are:
i. NOPAT can be computed specifically or can be taken from the company’s income statement.
ii. Invested capital is the money used to fund the specific project.
iii. WACC is the average rate of return a company expects to pay to its investors.
As an outcome of EVA computation, a positive number tells that a company has more than covered its cost of capital. A negative number indicates that the project did not make enough profit to cover the cost of doing business.
Importance of EVA:
Economic Value Added (EVA) is very important because it is used as an indicator to judge how profitable company projects are and it serves as a reflection of management performance. The economic value calculation succinctly summarises how much and from where a company created wealth.
The idea behind EVA is to move attention from just profit earning to wealth creation. EVA emphasises that businesses are truly profitable when they create wealth for their shareholders, and the measure of this goes beyond calculating the net income.
Market value added is an indicator which reflects the status of how much wealth has been generated by a company for its shareholders. Since the main goal of an organisation is to maximise shareholders’ wealth, market value added is an important measure to analyse how much value a company has added to the wealth of its shareholders. Higher the market value added, better it is. MVA is the amount by which the market value of the company’s stock exceeds the total capital invested in a company.
MVA is computed with the help of the following formula:
MVA = Market value of the firm – Total invested capital
Thus, two components are used to compute MVA, viz.:
i. Market Value of the Firm:
Market value of the firm comprises of two sub-components, i.e. –
Market value of a firm = Market value of equity + Market value of debt.
Market value of equity or market capitalisation is obtained by a product of outstanding shares and their market price. Similarly, market value of debt is calculated by taking a product of total quantity of debt and its market price.
ii. Total Invested Capital:
It comprises of total capital invested both by bond holders and equity holders. It also includes undistributed profits, i.e., retained earnings.
A company’s MVA indicates its ability to increase shareholder wealth over time. Value of MVA can be interpreted as the quantum of wealth that an organisation has been able to create for its investors beyond their investment in the company. Companies that are able to sustain or increase MVA over time attract more investment, which continues to enhance MVA.
Companies with positive MVA reflect that they have more market worth than their book values of invested capital. Thus, a high MVA is evidence of effective management and strong operational capabilities. Companies with high MVA attract investors not only because of the greater likelihood they will produce positive returns but also because it is a good indication they have strong leadership and sound governance.
Companies with negative MVA shows that there is lesser worth in the market of the investment as compared to actually invested in the company. This is a reflection of poor management and failure of the company to give back to the investors. Thus, a low MVA mean that value of management’s actions and investments in market is less than the value of the capital contributed by shareholders.
Traditional and Modern Control Techniques
Traditional Control Techniques:
1. Budgetary control
2. Standard costing
3. Financial ratio analysis
4. Internal audit
5. Statistical control
6. Break-Even point analysis
1. Budgetary Control:
Budgetary control is the process of developing a spending plan and periodically comparing actual expenditures against that plan to determine if it or the spending patterns need adjustment to stay on track. This process is necessary to control spending and meet various financial goals.
Purpose of Budgeting:
i. It is used for coordinating the various departments within a company
ii. Main purpose of budgeting is to make plans for future. It anticipates the results.
iii. Budgeting is the backbone of control
iv. Increase efficiency in the field of production
Types of Budget:
(a) Sales budget
(b) Purchase budget
(c) Capital expenditure budget
(d) Production and manufacturing budget
(e) Research and development budget
(f) Cash budget
(g) Administration expenses budget
(h) Operational budget
Benefits of Budgeting:
i. It helps management for making comparisons of the actual performance from the projected one
ii. It is a tool for allocating resources and implementing strategic plans.
iii. It charts a way of allocating and maximising the use of your resources
iv. The budget can be used to monitor and control
v. The budget assists planning
vi. Management by exception is possible
vii. The budget communicates and co-ordinates
viii. Maximum efficiency is achieved by avoiding wastage and losses
ix. The budget helps with decision-making
x. Budgeting helps in monitoring the finance in an organization.
xi. It helps in cut back the avoidable expenses.
2. Standard Costing:
Standard costing is the establishment of cost standards, for activities and their periodic analysis to determine the reasons for any variances. All the expenses are recorded and classified and then compared with the standards that were projected to find out any variance so that measures to improve efficiency may be taken.
3. Financial Ratio Analysis:
Under this technique a comparison of the financial statements (profit & loss a/c and balance sheet) is done to find the trends of change in profits, assets, liabilities etc. ratio analysis is the relation between various elements of financial statements expressed in mathematical terms
4. Internal Audit:
Under this technique internal auditors do the regular and independent appraisal of accounting, financial and other operations of business. They look beyond financial risks and statements to consider wider issues such as the organisation’s reputation, growth,
5. Statistical Control:
Statistical control us6s various statistical methods like to analyze the statistical data in the form of mean, median and mode or in the form of percentage etc. to find the deviations. For finding the reasons for deviations from the predetermined results a statistical report is prepared.
6. Break Even Point Analysis:
Company sells their product up to the breakeven point because it is point where cost equals to total sale value and company total will not get any loss. But sale below from this point means that total cost is more than total sale value and company will suffer losses.
Non Traditional/Modern Control Techniques:
Some of the modern techniques used for controlling are-
I. Zero base budgeting
II. Management audit
III. Network appraisal
I. Zero Base Budgeting:
Zero-Based Budgeting is a broad-reaching cost transformation effort that takes a “blank sheet of paper” approach to resource planning. It differs from traditional budgeting processes by examining all expenses for each new period, not just incremental expenditures in obvious areas.
Features are-
i. Zero-Based Budgeting forces managers to scrutinize all spending and requires justifying every expense item that should be kept.
ii. It allows companies to radically redesign their cost structures and boost competitiveness.
iii. Zero-Based Budgeting analyzes which activities should be performed at what levels and frequency and examines how they could be better performed potentially through streamlining, standardization, Outsourcing, offshoring or automation.
iv. The process is helpful for aligning resource allocations with strategic goals, although it can be time- consuming and difficult to quantify the returns on some expenditures, such as basic research.
II. Management Audit:
Analysis and assessment of competencies and capabilities of a company’s management in order to evaluate their effectiveness, especially with regard to the strategic objectives and policies of the business. The objective of a management audit is not to appraise individual executive performance, but to evaluate the management team in relation to their competition.
The management audit is a process of systematically examining, analyzing, and appraising management’s overall performance.
The appraisal is composed of ten categories given by American Institute of Management, examined historically and in comparison with other organizations.
1. Economic Function:
The economic function category in the management audit assigns to management the responsibility for the company’s importance to the economy. The value is based on what the company does, what products or services it sells, and how it goes about its business in a moral and ethical sense.
2. Corporate Structure:
The corporate structure review evaluates the effectiveness of the structure through which a company’s management seeks to fulfil its aims. An organization’s structure must strengthen decision-making, permit control of the company, and develop the areas of responsibility and authority of its executives.
3. Health of Earnings:
The health of earnings function analyzes corporate income in a historical and comparative aspect. The question this function seeks to answer is whether assets have been employed for the foil realization of their potential.
4. Research and Development:
The evaluation of research and development is essential because R&D is often responsible for a company’s growth and improvement in its industry, research should be examined from a historical and comparative view; the number of research workers employed; the ratio of research costs and staff to total expenses; and new ideas, information, and products turned out.
5. Service to Stockholders:
The evaluation of a company’s service to its shareholders can be assessed in three areas:
(1) The extent to which stockholders’ principal is not exposed to unnecessary risks;
(2) Whether the principal is enhanced as- much as possible through undistributed profits; and
(3) Whether stockholders receive a reasonable rate of return on their investment through the form of dividends.
6. Fiscal Policy:
The fiscal policy function of the management audit expresses the past and present financial policies.
7. Production Efficiency:
Production efficiency is an important function for manufacturing companies as well as non-manufacturing companies. Production efficiency is divided into two parts.
The first part, machinery and material management, evaluates the mechanical production of the company’s products.
The second aspect, manpower management, evaluates personnel in the organization
8. Directorate Analysis:
Directorate analysis covers the quality and effectiveness of the board of directors. Three principal elements are considered in the evaluation of the board. First, the quality of each director. Second, how well the directorate works together as a team. Third, the directors are assessed to determine if they truly act as trustees for the company.
9. Sales Vigour:
Sales vigour can be evaluated even though sales practices vary widely among industries. This can be accomplished after marketing goals have been determined and assessed.
10. Executive Evaluation:
Executive evaluation is the most important function of the management audit. The American Institute of Management has found that the three essential elements in a business leader are ability, industry, and integrity.
These elements provide a framework for the executive’s evaluation in the management audit and should also be the criteria used in selecting and advancing executives.
III. Network Analysis:
This technique is used for planning and controlling complex projects. The results of this analysis are represented diagrammatically.
There are two network techniques:
1. Critical path method
2. Programme evaluation and review technique
1. Critical Path Method:
The Critical Path Method (CPM) is one of several related techniques for doing project planning. CPM is for projects that are made up of a number of individual “activities.” If some of the activities require other activities to finish before they can start, then the project becomes a complex web of activities.
CPM can help to figure out:
i. How long your complex project will take to complete
ii. Which activities are “critical,” meaning that they have to be done on time or else the whole project will take longer.
iii. The standard method for communicating project plans.
2. Programme Evaluation and Review Technique (PERT):
PERT is a variation on Critical Path Analysis that takes a slightly more sceptical view of time estimates made for each project stage. To use it, estimate the shortest possible time each activity will take, the most likely length of time, and the longest time that might be taken if the activity takes longer than expected.
Use the formula below to calculate the time to use for each project stage:
(Shortest time + 4 x likely time + longest time) / 6
This helps to bias time estimates away from the unrealistically short time-scales normally assumed.
Critical Path Analysis and PERT:
Critical Path Analysis is an effective and powerful method of assessing:
i. What tasks must be carried out.
ii. Where parallel activity can be performed.
iii. The shortest time in which you can complete a project.
iv. Resources needed to execute a project.
v. The Sequence of activities, scheduling and timings involved.
vi. Task priorities.
vii. The most efficient way of shortening time on urgent projects.
An effective Critical Path Analysis can make the difference between success and failure on complex projects. It can be very useful for assessing the importance of problems faced during the implementation of the plan.
PERT is a variant of Critical Path Analysis that takes a more sceptical view of the time needed to complete each project stage.
Budgetary and Non-Budgetary Control Techniques (With Advantages and Disadvantages)
Undoubtedly, planning is a difficult task; executing is a more difficult task; but controlling is the most difficult task for a manager. Why? Because, planning is thinking; it is a mental and intellectual task; and executing is action, an implementation of planning. On the contrary, controlling is a synthesis of thinking and action. Planning is necessary for control but control is essential for making planning efficient. Since the birth of management no other functions of management could get as many techniques of working as the function of controlling.
There are a lot of techniques of control.
These techniques may broadly be put into two major categories:
1. Budgetary control techniques and
2. Non-budgetary control techniques.
1. Budgetary Control Techniques:
Budgetary control is one of the traditional techniques of managerial control. It is a widely recognised and popularly used control device. According to George R. Terry, “Budgetary controlling is a process of finding what’s being done and comparing these results with the corresponding budget data in order to approve accomplishments or to remedy differences.”
In the words of Theo Haimann, “Budgetary control refers to the use of budgets during the projected period in order to control the day-to-day operations so that they will coincide with the goals specified by the budget. Budgetary control involves a constant evaluation of the actual results in comparison with the established goals and corrective action if necessary.”
In practice, budgetary control is known as budgeting. “Budgeting,” according to Koontz and O’Donnell, “is the formulation of plans for a given future period in numerical terms.” It is related to budget planning and preparation as also to administrative control device.
Budget is both a planning function and a control technique. While making of the budget is considered a planning function, its administration is regarded as a controlling function. Budget is referred to as the pre-determined standards; with the help of it operations are compared and adjusted by the exercise of control. It reveals information regarding the progress of the performance. If need be, it assists the manager in taking corrective action so that the actual performance conforms to the planned performance. A budget reveals the anticipated results for a given future period in specific numerical terms.
Type of Budgets:
Budgets are varied and many. The types of budgets are based on their needs and purposes.
The major budgets are briefly explained below:
a. Sales Budgets:
A budget which is prepared for the purpose of sales is termed as a sales budget. The sales budget refers to the statement of anticipated sales expressed in financial terms for a given future period. It is prepared on the basis of past experience, company’s goals, competitive conditions, customers buying behaviour and attitudes, and other market conditions. This budget gives the anticipated sales figures.
It may be prepared in monetary terms and in terms of number of units. It may also be formulated on annual, half-yearly, quarterly and monthly bases. It may also be prepared on the basis of different market segments and on the basis of products. Further, it is used as a control device when the budgeted sales volume is compared with the actual sales volume. It also reflects the efficiency and effectiveness of sales department.
b. Production Budgets:
As the name implies, this budget is related to production. The production budget determines the volume of production. In other words, the number of units to be produced is decided so that the sales requirements must be met. Hence, the base of production budget is the anticipated volume of sales. On this basis, the manufacturing department prepares the schedule of production and decides its requirements. There may be different kinds of production budget, such as, annual production budget, half-yearly production budget and so on. It may be prepared for major products marketed by the enterprise.
c. Finished Goods Budgets:
A finished goods budget forms one of the bases of production budget. It determines the level of inventory the enterprise must maintain. In the words of Theo Haimann, “The finished goods budget will show the plan of the monthly opening inventory and the monthly closing inventory. It is conceivable that in case of seasonal fluctuations the policy of the enterprise will be that at certain times of the year the closing inventory should be of a higher level of units than at other times.”
d. Materials and Materials Purchases Budgets:
The materials budget is prepared on the basis of production budget. This budget reflects the requirements of different raw materials for manufacturing finished products for a given future period. At the time of preparation of this budget, problems relating to the procurement of raw materials are fully taken into account.
This budget is presented in terms of physical units. On this basis, purchase budget is prepared. The purchase department while preparing the budget reduces the estimates of the raw materials budget to monetary terms. This department also keeps in mind the inventory policy and production budget of the enterprise at the time of making the purchase budget.
e. Personnel Budgets:
Personnel budget is also termed as labour or manpower budget. This budget reflects the type of workers and personnel required, the number of overall workers required the wages rates for different categories of workers, labour cost per unit of production, etc. Personnel budget is generally based on standard labour hours. Requirement of workers is decided on the basis of direct labour budget which is prepared by the manufacturing department.
f. Revenue and Expense Budgets:
A budget which reflects the plans for revenues and operating expenses in monetary terms is termed as revenue and expense budget. Various revenues to be received like income from rents, royalties, and miscellaneous sources are shown in the budget. Similarly, operating expenses like rent, heat, power, office supplies, entertainment, etc. are included in operating expense budget.
There may be separate and individual budgets for individual revenue as well as individual expense. The revenue and expense budgets reveal whether the enterprise has received less or more earnings as against the projected earnings, or whether the enterprise has spent more or less than the projected expenses.
g. Capital Expenditure Budgets:
Capital expenditure budget is very significant in itself. It is because of the fact that this budget results in investment. A capital expenditure budget reveals in specific terms the capital expenditure during a specific period for plant, machinery, equipment, inventories and other capital additions of permanent nature. This budget is normally prepared for a long-run period divided into short-run period. In the words of Theo Haimann, “The overall figures of the capital expenditure budgets as they are planned are used as one of the indicators to predict national economic activity.”
h. Cash Budgets:
Cash budget is one of the important budgets because it reflects the estimated cash receipts and cash disbursements in a given future period. In the words of Koontz and O’Donnell, “The cash budget is simply a forecast of cash receipts and disbursements against which actual cash experience is measured.” It also shows the availability of excess cash to meet the obligations of the enterprise.
i. Research and Development Budget:
With a view to reducing costs and improving the quality of products, research and development activities are very much essential for any progressive and growth-oriented enterprise. This is the reason why every giant enterprise spends a huge sum of money on research and development by making a budget for it. This budget acts as an insurance for the enterprise. Normally, a specific percentage of profit is set aside for this purpose.
j. Balance-Sheet Budgets:
The balance sheet budget is a forecast about the status of assets, liabilities, and net worth of the enterprise as on a particular date in the future. This budget also shows the accuracy and effectiveness of other budgets which act as the source of change in the items of a balance sheet.
Advantages of Budgetary Control:
William H. Newman has put the advantages of budgetary control into three broad categories:
i. Improvement in planning
ii. Aid in coordination
iii. Comprehensive control.
The benefits which improve the planning function include stimulating thinking in advance, assisting in delegation of authority and responsibility, helping in effective utilization of resources and in promoting efficiency, and leading to specificity in planning. By promoting balanced activities, by developing team spirit, by encouraging exchange of information and by disclosing imbalance early budgetary control helps in maintaining coordination. Budgetary control is beneficial in the form of comprehensive control device.
It provides inclusive standards. It uses available reports on performance. According to Newman, “In conclusion, budgetary control should be regarded as both a procedural device and a psychological tool of administration. While its concrete form is in tables of figures, much of its benefit lies in the thinking and relationships that it promotes among executives.”
Disadvantages of Budgetary Control:
Budgetary control has the following disadvantages:
i. Budgetary control does not ensure satisfactory results.
ii. It is subject to human judgement and weaknesses.
iii. It requires much money, time and effort for its efficient use.
iv. It does not ensure adequate communication required for its success.
v. It is shrouded in uncertainties.
vi. It does not ensure quick results.
vii. It suffers from the problems of inflexibility.
viii. It does not ensure the cooperation of employees.
2. Non-Budgetary Control Techniques:
Besides budgetary control, there are several traditional non-budgetary control techniques widely practised in the process of managerial control.
The important non-budgetary control techniques are briefly described below:
a. Personal Observation:
Personal observation is perhaps one of the oldest devices guiding the manager in exercising control over the subordinates. It is an important ally of the manager entrusted with the task of controlling. With the help of personal observation a manager can easily gather first-hand information regarding his subordinates, their methods of working, their performance, etc. Thus, it exerts a high level of controlling influence.
In the words of McFarland, “His (manager’s) mere presence, even without overt observation, may be sufficient to generate a broad controlling influence. The possibility or the reality of being observed, often unpredictably, has an inevitable effect on workers…much depends, of course, on the degree of skill with which an executive creates the illusion of his presence, even during his absence.” There are no other devices capable of replacing observations.
According to Koontz and O’Donnell, “Budgets, charts, reports, ratios, auditors’ recommendations, and other devices of control can be helpful, if not essential to control. But the manager who relies on these devices and sits, so to speak, in a soundproof control room reading dials and manipulating levers can hardly expect to do a thorough job of controlling.” But it may be noted that observation should be well-planned; it should be systematic; it should be goal-oriented; and it should aim at evaluating the overall performance of the subordinates.
b. Example:
Example is another oldest technique of controlling. “Example is better than precept” is the guiding philosophy of this technique. The manager, who wants to control the subordinates, needs to control himself. His own example can exert great control influence; his own example would be a guiding force for the subordinates; and his own example would be the norm for the subordinates.
If, in any organisation, punctuality is to be maintained effectively, first of all, the manager must abide by the rule of punctuality. Normally, an average subordinate follows the path of his superior. According to McFarland, “By learning to make evaluations of his own work, the subordinate learns to think in terms similar to those of his own superior, thus, helping to prepare himself for advancement.”
c. Records and Reports:
Records and reports have also been used as the means of controlling since long. They come under the category of traditional non-budgetary control device. They contain details about past activities and performance. Hence, they have considerable control value. They provide valuable information which helps greatly in exercising control over the functioning of the subordinates. They are permanent source of information. Some records and reports may be descriptive while others may be statistical in nature. It may be noted that for a new manager records and reports may prove a great friend.
However, records and reports may also clog the organisational machinery if they are too numerous, too burdensome and too time- consuming. If reports and records are not read and consulted, they would be worthless and the time, energy and money spent on them would be a sheer waste.
d. Audit:
Audit is also an effective technique of control. It may be internal and external in nature. It may be financial and non- financial; quantitative and qualitative. Internal audit is now called operational audit. According to Koontz and Weihrich, “Operational auditing, in its broadest sense, is the regular and independent appraisal, by a staff of internal auditors, of the accounting, financial, and other operations of an enterprise.”
The job of operational auditors is normally restricted to auditing of accounts. However, they may be entrusted with the task of auditing the overall performance of the enterprise by comparing the actual results with the planned results. They may also audit the policies, procedures, methods, etc. of the enterprise. They may be encouraged to point out defects or problems in this regard. They may also make useful suggestions on the basis of their analyses.
e. Review:
Review like auditing is an effective control device. It emphasises qualitative factors. There may be several important managerial aspects which require in-depth review. Objectives may be reviewed; policies may be reviewed; personnel requirements may be reviewed; and similarly rules, methods, strategies, etc. may be reviewed so that they may be made more effective and efficient. It may be noted that even the techniques of control may also be reviewed to make them sound and up-to-date.
f. Standing Rules, Orders and Procedures:
According to McFarland, “By establishing rules, orders and procedures, the executive controls a great deal of routine behaviour and can develop performance habits on the parts of people in his organisation.” Rules are generally prohibited forms of behaviour whereas standing orders tell what to do in a given set of situations.
On the other hand, standing procedures point out the sequence of events or activities. However, standing rules, orders and procedures may also be misused. It is, therefore, essential that due care should be taken in their use. In this way, they are, like records and reports, the useful device of managerial control.
g. Statistical Data:
Statistical data are also useful tool of control. Statistical data become much more beneficial for control purposes when they are presented in chart or graphic form depicting the trends and relationships. According to Koontz and Weihrich, “Clear presentation of statistical data in graphic, tabular or chart form is an art that requires imagination.” Statistical data reveal several aspects of operation.
h. Break-Even Point Analysis:
Break-even point chart and analysis is an important and useful tool of managerial control. The credit to evolve this concept goes to Walter Roten Strauch.
A break-even point is that point at which the overall sales revenue exactly equals the overall production cost. It, thus, depicts the relationship of various levels of sales volume and production costs, sales prices and sales mix to profits. Of course, if sales revenue exceeds this point the enterprise certainly earns profit, and if sales revenue is below this level there would be a loss to the enterprise. In brief, at a greater volume the enterprise earns a profit and at a lesser volume it suffers a loss.
Thus, in all conditions the enterprise seeking profits has to sell more. According to Theo Haimann, “Break-even analysis is primarily concerned with the effect which changes in fixed costs, changes in variable costs, changes in sales volume, changes in sales prices, and changes in sales mix will have on profits. It is correct that the break-even point is that point of capacity where operations pass from being profitable to a loss or vice versa.”
The break-even point is based on certain assumptions. First, fixed and variable costs are accurately identifiable. Second, the fixed costs remain constant at all volume levels. Third, variable costs change proportionately at all volume levels. Fourth, the price does not change at various levels of output. And finally, the relationships are real only at a particular point of time.
This analysis is useful in several ways – (i) It acts as a guide to management; (ii) It is an interesting tool for earning maximum profit; (iii) It depicts the relationships of sales volume, costs and profit; (iv) It reflects the efficiency and quality of management. However, it works with limitations. In the words of Fred V. Gardner, “In itself, a break-even point moves only with changing conditions and, in moving, flashes a warning. To follow-through from this warning requires a detailed control.”
i. Censure:
Censure is a type of disciplinary action. It is mild in nature. It is a form of reprimand, ridicule, criticism, rebuke or disapproval. Although all the above techniques of control are positive in nature, censure is a control technique having negative nature. This is the reason why most of the managers commonly do not favour this technique of controlling.
However, a point may reach where positive control techniques fail to yield desired result and it becomes imperative for the manager to use such a negative approach. At times, such an approach helps improve the situation in right direction. When even this approach fails, the manager may take more severe action in the forms of discharges and layoffs.
In the words of McFarland, “It is imperative for every executive to use this instrument with wisdom and understanding. Used recklessly, with cruelty or unfairness or in a thoughtless manner, it can become a dangerous weapon. On the other hand, it is equally unwise for an executive to avoid using it where conditions could be improved by it.”
The above-mentioned techniques of control are considered traditional in nature. In recent years, several modern techniques of planning and control have been developed. In particular, operations research has contributed in a significant manner several techniques of control which can successfully be used in the field of business and commerce. These techniques help to a great extent in data processing.
Some of the modern control techniques are – information technology, Programme Evaluation and Review Technique (PERT), logistic systems and various other electronic devices. Further, Time-Event Networks, Value Engineering, Quality circles, computer-aided design (CAD), computer-aided manufacturing (CAM), etc. are used as the techniques of control for improving productivity. Application of computer in the field of business has also improved the controlling efficiency of executives.
Financial and Non-Financial Control Techniques (With Example, Tools, Formula and Calculations)
Techniques of control are of two main types – (a) financial and (b) non-financial.
Four main techniques of financial control are the following:
1. Budgets:
A budget is a formal financial projection. It states an organisation’s planned activities for a given period of time in quantitative terms, such as – rupees, hours, or number of products. Budgets are prepared not only for the organisation as a whole but also for various divisions and departments within it. The budget provides yardstick against which managers can measure performance and make comparisons (as with other departments or previous years).
Budgets are probably the most widely used control devices. However, budgets themselves do not control. Budgets act as standards. In essence, a budget is a plan for allocating efforts and resources. A budget is a statement of expected results or requirements expressed plans, objectives, and programmes of the organisation in numerical terms.
Preparation of the budget is primarily planning function; however, its administration is a controlling function.
Many different types of budgets are in use. Some may be expressed in terms other than rupees. For example, an equipment budget may be expressed in numbers of machines, material budgets may be expressed in kilograms, pieces, gallons, and so on. Budgets not expressed in rupees can usually be translated into rupees for inclusion in an overall budget.
Defects:
No doubt budgets are useful for planning and control. However, they are not without their dangers.
i. Inflexibility:
Perhaps the greatest danger is inflexibility. This is a real threat to organisations operating in an industry with rapid change and high competition. Rigidity in the budget can also lead to ignoring organisational goals for budgetary goals. The financial manager who won’t go Rs. 500 over budget to make Rs. 5000 is a classic example. Budgets can hide inefficiencies. The fact that a certain expenditure has been made in the past often becomes justification for continuing the practice even when the situation has changed considerability.
ii. Inaccuracy:
Managers may also pad budgets because they anticipate that their budgets will be cut by superiors. Science the manager is never sure how severe the cut will be, the result is often an inaccurate, if not unrealistic, budget.
Need For Performance Incentives:
The answer to effective budgetary control may be to make the manager and any concerned employees accountable for their budgets. Performance incentives can be tied to budget control accuracy, and fulfillment. In other words, if it is worth budgeting, it is worth budgeting right. In addition budgets should also be tied not only to financial data but also to customer satisfaction.
Budget for what is takes to satisfy the customer would be the rule of thumb for this logic. The real danger is that organisations can get so hung up on measuring themselves by sticking to their own sets of rules, focusing internally, and watching their budgets that they forget their customers. Yet the customer is what business is all about, as P. F. Drucker cautioned long ago.
Zero-Base Budgeting:
Originally develop by Taxes instruments Zero-base budgeting (ZBB) was designed to stop basing this year’s budget on last year’s budget. Zero-base budgetary requires managers to justify budget items in detail regarding previous spending or allocations. That is, activities must be justified in each and every period.
ZBB requires each manager to justify an entire budget request in detail. The burden of proof is on each manager to justify why any money should be spent. Under ZBB, each activity under a manager’s discretion is identified, evaluated, and ranked by importance. Then each year ever activity in the budget is on trial for its life and is matched against all the other claimants for an organisation’s resources. The reason is that there is always competition for allocation of limited funds among alternative uses.
2. Financial Statements – Summarising an Organisation’s Financial Status:
In addition to budgets, many managers use other types of financial information for exercising control.
A financial statement is a summary of some aspect of an organisation’s financial status. The information contained in such a statement is essential in helping managers maintain financial control over the entire organisation.
There are two basic types of financial statements:
i. The balance sheet, and
ii. The income statement.
A balance sheet summarises an organisation’s overall financial worth — that is, assets and liabilities — at a specific point in time.
Assets are the resources that an organisation controls; they consist of current assets and fixed assets. Current assets are cash and other assets that are readily convertible to cash within a year. An example is inventory or sales for which payment has not yet been received (accounts receivable). Example of fixed assets are property, buildings, equipment, and the like there have a useful life that exceeds one year but there are usually harder to convert to cash. Liabilities are claims, or debts, by suppliers, lenders, and other nonowners of the organisation against a company’s assets.
The balance sheet presents the organisation’s overall financial worth at a specific point in time. By contrast, the income statement or profit and loss account summarises an organisation’s financial results — revenues and expenses in a quarter or a year.
Revenues are assets resulting from the sale of goods and services. Expenses are the costs incurred to produce those goods and services. The difference between revenues and expenses, called the bottom line, represents the profits or losses incurred over the specified period of time.
Regardless of the type of financial information used, the income statement is meaningful (useful) only when compared with either the historical performance of the organisation or the performance similar organisations. For example, knowing that a company had met income of Rs. 1, 00,000 last year does not indicate much by itself. However, when compared to last year’s net income of Rs. 3500,000 or to an industry average of Rs. 3500,000 much more can be determined about the company’s performance.
3. Financial Ratio Analysis – Indicators of an Organisation’s Financial Health:
No doubt bottom line is the most important indicator of an organisation’s financial health. However, managers also rely on use ratio analysis. This is the practice of evaluating financial ratios to determine an organisation’s financial health.
Ratio analysis refers to the calculation and use of accounting ratios to analyse the trading performance, liquidity and financial security (strength/health) of a company over time and by comparison with other firms (enterprises).
Four main financial ratios are the following:
(i) Liquidity ratios indicate how easily an organisation’s assets can be converted into cash, (i.e., made liquid). Liquidity ratios are used to judge how well an organisation will be able to meet its short-term financial obligations. The current ratio (current assets divided by current liabilities) and the quick ratio (current assets minus inventories divided by current liabilities) are examples of liquidity ratios.
(ii) Debt management ratios indicate the degree to which an organisation can meet its long-term financial obligations. Debt (sometimes called leverage) ratios measure the magnitude of owners’ and creditors’ claims on the organisation and indicate the organisation’s ability to meet long-term obligations. The debt to equity ratio and total debt to total assets ratio are two common debt ratios.
(iii) Activity ratios (also known as asset management ratios) indicate how effectively an organisation is managing its assets such as – whether it has obsolete or excess inventory on hand.
(iv) Profitability ratios — also known as Return on Investment (ROI) or return on assets (ROA) indicate how effective management is in generating a return, or profits, on its assets. Activity ratios evaluate how effectively an organisation is managing some of its basic operations. Asset turnover, inventory turnover, average collection period, and accounts receivable turnover represent some commonly used activity ratios.
Profitability ratios — also known as return on investment (ROI) or return on assets (ROA) — indicate how effective management is in generating a return or profits, on its assets. There ratios indicate the organisation’s operational efficiency, or how well the organisation is being managed. Gross profit margin, net profit margin, and return on investment (ROI) are all examples of profitability ratios.
Financial ratios are meaningful only when compared to past ratios and to ratios of similar organisations. Also financial ratios reflect only certain specific information, and, therefore, they should be used in conjunction with other management controls.
4. Audits – External versus Internal:
Apart from verifying the accuracy and fairness of financial statements, the audit also serves as a useful tool for managerial decision making Audits are formal verifications of an organisation’s financial and operational systems and performance.
Audits are of two types:
i. External, and
ii. Internal.
i. External Audits — Financial Appraisals by outside Experts:
An external audit is a formal verification of an organisation’s financial accounts and statements by outside experts. The auditors are certified Chartered Accountants (CAs) who work for an accounting firm (such as – Price water house Coppers or Baltiboy & Co.). Their task is to verify that the organisation, in preparing its financial statements and in determining its assets and liabilities, by followed accepted accounting principles. External audits are limited to financial matters. Most are conducted to certify that the organisation’s accounting methods are fair, consistent, and conform to existing practices.
ii. Internal Audits — Financial Appraisals by inside Financial Experts:
An internal audit is a verification of an organisation’s financial accounts and statements by the organisation’s own personnel or professional staff. Their jobs are no different from those of outside experts, i.e., to verify the accuracy of the organisation’s records and operating activities. Internal audits also help to find out (reveal) inefficiencies and thus help managers evaluate the performance of their control systems.
An audit that looks at areas other than finance and accounting is known as a management audit. Management audits seek to evaluate the overall management practices and policies of the organisation. They can be conducted by outside consultants or inside staff; however, a management audit conducted by inside staff can easily result in a biased report.
Break-even charts depict graphically the relationship of volume of operations to profits. The break-even point (BEP) is the point at which sales revenues exactly equal expenses. Total sales below the BEP result in a loss; total sales above the BEP result in a profit.
Fig. 5 shows a typical break-even chart. The horizontal axis represents output, the vertical axis represents expenses and revenues. For analytical simplicity most break-even charts assume that there are linear relationships and all costs are either fixed or variable. Fixed costs do not vary with output, at least in the short-run, when production capacity remains constant.

They include rent, insurance, and administrative salaries. Variable costs vary with output. Typical variable costs include direct labour and materials. The purpose of the chart is to show the break-even point and the effects of changes in output. A break-even chart is useful for showing whether revenue and/or costs accord with planned targets.
Break-even chart are very useful for exercising financial control. There are used for profit planning and profit control.
Note that the smaller the Break-Even Quantity (BEQ) the larger is the profit of the firm. So a company will always try to reduce its BEQ as much as possible for increasing its total profit. Also note that the break-even quantity is not a fixed number.
It can be reduced and profit can be increased in three ways:
(1) By reducing total fixed cost,
(2) By reducing total variable cost, and
(3) By raising the price of the product of the firm.
And if all the three measures can be taken simultaneously then the BEQ can be reduced to a very small number. A simple example will make the point clear.
Suppose a company’s Total Fixed Cost (TFC) is Rs. 300,000. Its short-run production capacity is 10,000 units. Its Average Variable Cost (AVC) is Rs. 10 and the price of its product (P) is Rs. 50 (a) Find out the BEQ and break-even sales value, (b) Suppose the company fixes a profit target of Rs. 20,000. How many units are to be produced and sold to reach the target? (c) Find out the maximum profit the company can make in the short run. (d) What can be company do to increase its profit under existing cost conditions, assuming that it cannot change the price of its product?
New Tools of Financial Control:
In addition to traditional financial tools modern managers are using systems such as economic value-added, market value-added, activity-based costing, and corporate governance to exercise effective financial control.
1. Economic Value-Added (EVA):
Numerous companies have set up economic value-added (EVA) measurement system as a new way to assets financial performance. EVA can be defined as a company’s tangible assets. The main intention of measuring performance in terms of EVA is to capture all the things a company can do to add value from its activities, such as – running the business more efficiency (profitably), satisfying customers, and rewarding shareholders.
The performance of each job, department, process, or project in the organisation is measured (or evaluated) by the value added. EVA can also help managers make more cost-effective decisions and carry out more cost-effective operations.
Economic Value Added (EVA) is a measure of a firm’s overall profit (loss) position when allowance is made for the opportunity/economic costs of the firm’s capital (that is, the revenues the firm’s assets could have earned in some alternative use). Whereas accounting profit = sales revenue less accounting costs, EVA = sales revenue less accounting cost less opportunity or economic costs.
To illustrate assume sales revenue is Rs. 1,000,000 and accounting cost is Rs. 900,000; on conventional criteria the firm thus makes an accounting profit of Rs. 100,000. However, when allowance is made for the opportunity cost of the firm’s assets if liquidated and redeployed in an alternative use the picture changes. If the firm’s assets could have earned, say 200,000 in some alternative activity (such as – depositing the money on interest-bearing deposit with a bank), then the positive accounting profit is turned into an economic loss of Rs. 100,000. Thus shareholder’s wealth has been destroyed rather than created in this case.
However, whilst producing accurate accounting cost and profit data can be difficult, obtaining reliable economic cost and profit data can be even more problematic. For example, a high proportion of the investment in the firm’s current activity may represent a sunk cost with little prospect of recovery, if liquidated. At the same time there is a difficult in identifying which are likely to be viable alternative activities where the firm’s new investment might yield higher profit returns than currently being achieved.
Market value-added (MYA) measures the stock markets estimate of the value of a company’s past and projected capital investment projects. For example, when a company’s market value (the value of all outstanding stock plus the company’s comulative — past and current — debt) is greater than all the capital invested in it from shareholders, bondholders, and retained earnings, the company is said to have a positive MVA.
This gives a clear indication that it has increased the value of capital invested in it and thus created shareholder wealth. A positive MVA mostly goes hand-in-hand with a high overall EVA measurement.
3. Activity-Based Costing (ABC):
Managers measure the cost of producing goods and services so they can be sure they are selling those products for more than the cost to produce them. The conventional methods of costing assign costs to various departments or functional areas of business such as -purchasing, manufacturing, human resources, and so on. With a recent shift to more horizontal, flexible organisations has emerged a new approach called activity-based costing (ABC). It allocates costs across business processes.
ABC attempts to identify all the various activities needed to provide a product or service and allocate costs on the basis of such identification. For example, an ABC system might list the costs associated with processing orders for a particular product, different production schedule for it, producing it and shipping it. Since ABC allocates costs across business processes, it provides a fairly accurate picture of the cost of various products and services.
Furthermore, it enables managers to evaluate whether more costs are incurred on those activities which add value (meeting customer deadlines, achieving high quality) or on activities that do not add value (such as -processing internal paperwork). They can then focus on reducing costs associated with activities which do not make positive value additions.
4. Corporate Governance:
Many organisations have moved toward increased control from the top in terms of corporate governance. Traditionally it has been defined as the ways in which an organisation safeguards the interests of shareholders. Of late the term corporate governance has been expanded to refer to the framework of systems, rules, and practices by which an organisation ensures accountability, fairness and transparency in its relationship with all its stakeholders — both internal such an investors and employees, and external such as customers and the general public.
Corporate governance became a cause of serious concern some time ago in the context of the failure of top executives and corporate directors to provide adequate monitoring and control at failed companies. In some cases, financial reporting systems were manipulated to prepare and present false results (reports) and suppress the truth such as internal failures.
With the failure of large firms such as Lehman Brothers and Bear Stearns in 2008, corporate governance again came to the forefront as a burning issue. Lax oversight and inadequate monitoring accounted for the failure of these forms and generated a worldwide economic crisis.
No doubt under control (or less-than optimal) control is a serious problem likewise over control of employees can do serious damage to an organisation as well. Managers might feel justified in monitoring e-mail and Internet use. Yet employees often resent and feel demeaned by close monitoring that limits their personal freedom and makes them feel as if they are constantly being watched and monitored and their activities are being scrutinised.
Excessive control of employees can lead to such damaging consequences as demotivation, low morale, lack of trust, and even hostility among workers. Managers have to strike an appropriate balance. Then have also to develop and communicate clear policies regarding monitoring at the workplace. Although monitoring and control are important, good organisations also depend on mutual trust and respect among managers and employees so as to make organisational control really effective.
Non-Financial Control:
Time-Related Charts and Techniques:
Gantt charts, the Critical Path Method (CPM), and the Programme Evaluation and Control Technique (PECT) are tools used to plan and schedule. These same tools can also be used for controlling once the plans have been put into action. By tracking actual progress compared to planned progress, activities which fall behind schedule can quickly by identified.
Scheduling:
Scheduling is the process of examining the timing of event and activities. Schedules generally list what activities need to be completed, the order in when activities are to carried out, who is responsible for completing specific activities, and deadlines for when the activities are to be completed. Scheduling gets reflected in time-bound chart and techniques.
A Gantt chart is a specific type of control chart and is a useful scheduling tool. A Gantt chart is a bar graph that indicates the relationship between planned activities and completed activities and time. A sample Gantt chart is presented in Fig. 6.
As shown in Fig. 6, activities are listed along the left side of the chart. Time is represented on the horizontal axis. Two horizontal bars are developed for each activity where one bar represents planned time and the other represents actual progress. Consequently, visual inspection provides a quick and easy method of determining if projects or activities are on schedule.

The Programme Evaluation and Review Technique (PERT) provides another means for evaluating the timeliness of activities. PERT is sometimes referred to as PERT network analysis, and it is related to another scheduling technique called the Critical Path Method (CPM).
PERT was developed in the 1950s for coordinating more than 3,000 contractors working on the Polaris submarine weapon system. This method is thus a useful tool when projects are complicated. One outcome from PERT is a flowchart diagram that identifies activities needed to complete a project and the time and costs associated with each activity.
PERT analysis includes events, activities, and critical paths. Events (sometimes called milestones) represent the completion of major activities to be scheduled. Activities are the actions that take place. A critical path is the longest or most time consuming sequence of events required to complete a project (or a phase within it).
Non-financial control includes network analyses and management audit. Network analysis is of two types — PERT and CPM. These two techniques are now described.
Network analysis or planning refers to techniques for planning and controlling complex projects by recording their component parts and representing them diagrammatically as a network of inter- related activities.
Network analysis techniques includes:
1. Programme Evaluation and Review Techniques (PERT), and
2. Critical Path Method (CPM).
1. Programme Evaluation and Review Technique (PERT):
PERT is essentially a network technique. It embraces three main aspects of project, viz., planning, monitoring and controlling. It is essentially used in scheduling, planning and controlling. The network aspect of the part mechanism provides the framework for treating a whole array of project management issues. Events are represented by circles, activities by arrows, and the lengths of activities by the lengths of the arrows.
Optimising networks often involves the use of computers. This technique was first adopted in defence and then in industry.
Network analysis is applied in case of large-scale projects in civil engineering and shipbuilding or to measure repair or maintenance projects or new products launches. It is used to identify problem areas where bottlenecks may arise (occur) and where additional resources (funding) may be needed.
2. Critical Path Method (CPM):
Critical path analysis (CPA) or critical path method (CPM) is a planning method or technique which shows the interrelationship in sequence of all the activities involved in undertaking a specific project. The network of activities highlights those operations or activities which are critical for the successful completion of the project with in the scheduled or allocated time scale. CPM differs from other techniques of network analysis in two ways – (a) planning is separated from scheduling; and (b) time and costs involved are directly related. This method is now discussed in detail.
To mininise the amount of time needed to carry out a complex project, managers frequently use a process known as Critical Path Analysis (CPA).
Critical path analysis is a technique of operations research in which a project is represented by a diagram containing a time schedule for each segment of the project. Then a line is drawn to show the sequence of tasks and the cost and time factors involved. See Fig. 10.
CPA was developed by mathematicians Morgan Walker and James Kelley, and was first used in 1957 by the chemical manufacturer DuPont, to schedule a programme of factory closures in the most cost effective way. By following Walket’s and Kelley’s advices. DuPont saved 25% on the shutdowns. In the early 1980s NASA used critical path analysis to defeat Soviet Russia in the Space Race. Through careful project scheduling. NASA was able to advance its spacecraft and rocket development programmes.
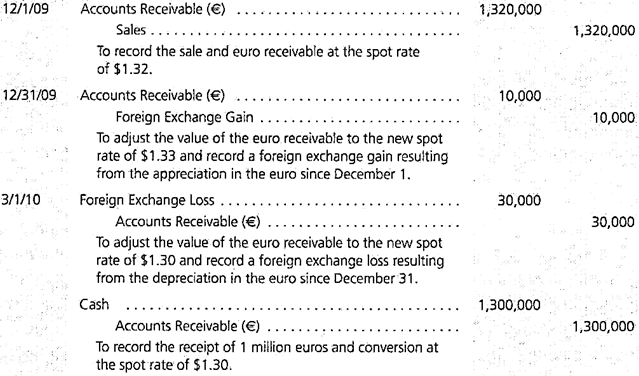
On this critical path network for a 20 day project the nodes circles record finish times. The time the task should take is recorded at the top, while the time it must be completed by to keep the project on track is recorded at the bottom Tasks B, D, and G form the critical path, as they must be completed promptly. All other tasks have more time than they need.
Planning Tool:
CPA is a planning-cum-control tool that plots out a project’s stages in a logical sequence, indicating which of the component activities need to be finished before others can start. It allows for activities to be scheduled simultaneously for saving time. Activities that are critical to the project are identified — these are steps, which if delayed, will hold up the completion of the whole project.
Project managers illustrate this information visually, using a step by-step network diagram. The most important part of the diagram is the critical path, which shows the activities where there is no float (spare) time. If a critical activity is likely to be delayed, management will need to act, probably by employing extra people and machinery. These resources can be moved from non-critical activities that have float time.
Saving Time and Money:
Manufacturers often use CPA to plan the launch of a new product. By identifying tasks which can be carried out simultaneously, the manufacturer are supposed to be able to reduce the amount of time needed for development, allowing it to launch into the market sooner. Completing projects earlier also reduces costs. For example, a firm might use CPA to reduce the amount of money spent on hiring expensive machinery. By studying the network the manager can predict when to hire a piece of machinery and for how long.
Other Control Techniques:
i. Written Reports:
Written reports can be prepared on a periods or an “a necessary” basis. There are two basic types of such reports analytical and informational. Analytical reports interpret the facts they present, informational reports present only the facts preparing a report is a four- or five-steps process, depending on whether it is informational or analytical.
The steps are:
(1) Planning what is to be done,
(2) Collecting the facts,
(3) Organising the facts,
(4) Interpreting the facts (this step is omitted with informational reports), and
(5) Writing the reports.
Most reports are to be prepared for the benefit of the reader and not the writer. In most cases, the reader wants useful information not previously available.
ii. Direct Observation:
There are various examples of control by direct observation. Three such example one store manager’s daily tour of the facility (warehouse), a company president’s annual visit to all branches and a methods study by a staff industrial engineer. No doubt this method of control is/time consuming. However, personal observation is sometimes the only way to get an accurate picture of what is actual going on.
But there is one major proper with this method. The employees may treat a superior’s visit with suspicious (or even apprehension). Another problem is that behaviours change when monitored. Another potential inaccuracy lies in the interpretation of the observation visits and direct observation is treated with favour or can have strong positive effect when employees view these as a display of the manager’s interest.
iii. Key Success Factors:
Key success factors are those which are of great importance to organisational performance. Consequently these factors require constant, ongoing monitoring by managerial personnel. These factors normally depend on successful performance by more than one individual in the firm. Three key success factors include product, quality, customer service and employee moral.
Strategic control is the process of tracking actions as they are implemented. The purpose of strategic control is to observe variances from the plan and make adjustments accordingly.
Top 3 Modern Techniques of Control: Balanced Scorecard, Integrated Ratio Analysis and Economic and Financial Measures
A large number of techniques have been developed for managerial control. Personal observation, unified plans, statistical analysis and reports, break-even analysis, budgets, etc. are traditional techniques of control.
Some of the modern techniques of control are as follows:
1. Stakeholders Approach (Balanced Scorecard).
2. Accounting Measures (Integrated Ratio Analysis).
3. Economic and Financial Measures-
(a) Economic Value Added
(b) Market Value Added.
1. Balanced Scorecard (BSC) (Stakeholders’ Approach):
The concept of Balanced Scorecard was introduced by Robert Kaplan and David Norton in 1992. Balanced scorecard identifies and links key performance measures (both financial and non-financial) to provide a comprehensive view of the business. It combines both quantitative and qualitative measures so as to meet the expectations of different stakeholders. Under it performance measurement is related to the choice of strategy.
The four perspectives of the Balanced Scorecard are described below:
a. Financial Perspective:
In this perspective survival, success, growth and prosperity are the main goals. Return on capital, cash flow, revenue growth, cost reduction, liquidity and project profitability are the key measures. For example, if a company adopts a ‘sustain’ strategy for a particular business unit, maintaining gross revenue can be its financial measure.
Financial perspective indicates whether a company’s strategy and operations add value for shareholders. For organizations that do not have shareholders, the financial perspective indicates how well the strategy and operations contribute to improving the financial health of the organization.
Financial measures by themselves are not sufficient to guide performance in creating value. These measures tell the story about the past but not about the future.
b. Customer Perspective:
Customer acquisition, retention and satisfaction are the main goals in this perspective. Measures used to judge value added for customers are market share, transaction cost, customer loyalty, satisfaction index, supplier relationships, and key accounts. On time delivery, defects per shipment, cost and service are the leading indicators of customer perspective.
Customer satisfaction measures indicate whether the company is meeting the expectations of customers. Customer retention or loyalty indicates how well a company is doing in keeping its customers. Market share indicates a company’s proportion of the total business in a particular market. Customer profitability measures the profit generated per customer. Customer perspective recognizes the fact that if business units are to achieve long-term superior financial performance, they must create and deliver products and services that are valued by customers.
c. Internal Business and Production Process Perspective:
Core competence, critical technologies, business processes and key skills are the main goals in the perspective. The key measures of performance used are efficiency, cycle times, unit costs and defect rates. Good supplier relations and process improvement to reduce time lag between receipt of order and delivery to the customer are important. Continuing earlier example (given in financial perspective), if maintaining gross revenue is a company’s financial objective and the company determines that on-time delivery increases customer retention, then the internal business perspective requires decreasing production stoppages.
d. Learning and Innovation Perspective:
The main goals here are continuous improvement and new product development. Productivity of entrepreneurship, new ideas and suggestions from employees, employee productivity, retention and satisfaction, rate of improvement are the key measures of performance.
Employee satisfaction recognises significance of employee morale. Employee retention focuses on development of intellectual capital. Employee productivity recognises the output per employee. Incentives and environment should be created to promote all these.
There is a cause and effect relationship between the internal business perspective and learning perspective. Employees who do the work are the best source of new ideas for better business processes. For example, an auto worker suggested that increasing the height of an automobile assembly line made it easier for workers to screw on the lug nuts for wheels.
Raising the height of the assembly line improved productivity and reduced back injuries for workers.
Advantages of Balanced Scorecard:
(a) Balanced scorecard integrates various financial and non-financial measures of performance into a single system. It provides a comprehensive framework for translating a company’s strategic objectives into a coherent set of performance measures.
(ii) It avoids sub-optimization by forcing top management to consider all important operational measures together. The behaviour of employees is focused on actions that directly or indirectly relate to achieving strategic objectives.
(iii) The Balanced Scorecard focuses attention on strategy and vision.
(iv) It provides strategic feedback and learning thereby facilitating communication and understanding.
(v) It shows the inter-relationships between goals and activities that are linked to their achievement.
(vi) It empowers all levels of the workforce by educating them about their company’s strategy and changes and learning required to implement it successfully.
Balanced scorecard should not be considered a panacea. Its implementation is beset with several pitfalls. It needs to be widened to take care of social responsibility and environmental concerns.
Balanced Scorecard in Indian Industry:
Does the Balanced Scorecard have any special relevance in the Indian context? Kaplan is of the view that too many South Asian companies have a limited strategy of getting business by offering the cheapest prices. “If Indian companies want to move beyond that, then managers must determine a more evolved strategy that includes a focus on product innovation and customer relationships. The BSC provides the guidelines for strategy development and deployment.”
At last count, around 25 Indian companies were reported to be using the BSC and these include Godrej, RPG, Bharti, Dr. Reddy’s and the Tatas. Goodlass Nerolac paints is a recent user and has created a 25-objective BSC, with which it seeks to double revenue in five years by retaining leadership in industrial paints and growing in decorative. Managing director HM Bharuka is the ‘owner’ of five key objectives, while the other 20 are allotted to heads of departments. “This has helped break the wall between various departments.”
He says, “Otherwise, people were just focused on their own areas and had no empathy with larger corporate goals.” Meanwhile, Tata group company Indian Hotels has recently moved to create an automated version of the BSC, in partnership with the Mumbai-based Stem Computer Systems. Stem, in-turn, has gone on to use Taj experience to create an internet-based BSC software package, which Cedar will market world-wide, where it will compete with previous versions created by SAP, Oracle and numerous other software companies.
The BSC has obviously spawned a whole industry, which is a possible measure of its bankability. Kaplan, however, prefers a measure that relates to the success of the companies that have used it. Mobil, the world’s most profitable oil company, has said that it “runs its business off the BSC,” and Hilton Hotels, which has raised customer retention from 6 to 56 per cent has called it a “tremendous enabler.”
Where does the BSC go from here? “The next growth in application will be in the public sector, healthcare, nonprofit organizations and in emerging markets like India,” says Kaplan.
BSC facilitates the following functions:
(i) Translating strategy and strategy objectives into actionable goals and initiatives.
(ii) Communicating strategy and strategy objectives throughout the organisation.
(iii) Setting achievable targets and initiating processes to achieve those targets.
(iv) Reviewing performance and feedback to executives about the status of strategy implementation and business success.
2. Integrated Ratio Analysis (Accounting Measures):
Analysis of accounting ratios or financial statement analysis is a popular technique of judging the financial performance of business enterprises. Separate ratios are calculated to judge profitability, liquidity, solvency, etc. of a business. Various ratios may be integrated for judging overall performance. Return on Investment (ROI) is a technique of integrated ratio analysis.
Return on Investment:
Return on investment (ROI) is a useful technique of controlling overall performance. It is also known as return on capital employed. The essence of this technique is that profit is taken not as an absolute figure but is considered in relation to the invested capital. It has been the key technique in the control system of the Du Pont Corporation of the U.S.A. Rate of return is calculated by dividing net profits with the total investment. In order to avoid the distorting effect of fluctuations in operating assets and liabilities gross assets are taken as investment. Net profit is taken before taxes and interest.
As a control technique, return on investment offers the following advantages:
(i) It focuses attention on the basic objective of business, i.e., profit earning and relates them to capital invested in business.
(ii) It indicates how effectively resources are being utilized. It makes management alert to wastage and inefficiency. It reflects the operating efficiency of the enterprise.
(iii) ROI is helpful in decentralization of authority. By defining a target rate of return for each department, departmental heads may be given autonomy of management.
(iv) It is a useful means of comparing the performance of business over the years as well as with other firms. It also helps in comparing performance of different divisions and departments of the enterprise. It is a sound basis for inter firm comparisons.
(v) It facilitates balanced use of capital resources. It identifies areas where capital is being fruitfully employed so that the future operations may be planned accordingly. Thus ROI helps in rational allocation of resources.
The limitations of return on investment are as follows:
(i) It lays too much emphasis on financial factors ignoring other factors like executive skills, public relations, research and development, employee morale, etc. In order to improve current ROI, managers may neglect long term needs like R&D.
(ii) It requires too many calculations and continuous recording which is time consuming and expensive.
(iii) Valuation of assets becomes difficult as prices change over time. Moreover, it is difficult to find out a standard rate of return for comparisons.
(iv) It may discourage risk-taking in the long run as it tends to encourage conservatism.
In spite of these limitations, ROI can be used as a total control device because it reflects the overall objectives of business. In the long run, it can be the conclusive proof of good management.
3. Economic and Financial Measures:
a. Economic Value Added (EVA):
The term ‘Economic Value Added’ was coined by Joel Stern and it is a registered trade mark of Stern Stewart & Co. (USA). Economic Value Added means any surplus generated from operating activities over and above the cost of capital. It is the excess profit of a firm after charging cost of capital. It is the corporate surplus that may be shared by the employees, management and shareholders. EVA is based on the simple idea that an enterprise needs to earn more than the cost of capital.

EVA is regarded as comprehensive measure of performance. This measure can be applied to each business segment within a company to find out EVA contribution of each segment of the company.
Several companies (more than 300) such as Coca Cola, Whirlpool, Infosys, Hindustan Lever, etc. have successfully adopted EVA.
The main applications of EVA are as follows:
(i) Business Planning – EVA is a better indicator of efficiency than profit after tax (PAT). A company can improve shareholders’ value by increasing its EVA and not PAT. Therefore, EVA serves a better tool of planning.
(ii) Good for Investors – On the basis of EVA, investors can determine whether a firm is worth investing money. EVA is a running score showing how well managers are performing their task of creating wealth.
(iii) Valuation of Goodwill and Shares – Valuation is an important issue in financial decision-making, particularly in mergers and acquisitions (M&A). EVA spread of a company in comparison with EVA spread of other companies in the same industry can be used as the basis for valuation of goodwill and shares.
(iv) Employee Compensation – EVA can be widely used as a base for executive compensation. EVA linked employee compensation is the best way to set accountability towards shareholders and protecting and improving shareholders value.
a. EVA is the most powerful financial performance measurement system most directly linked to creation of shareholder wealth.
b. It helps to enhance the market value of a firm, and measure the true economic profit.
c. EVA is religiously followed by the world’s leading corporate and financial giants like Coca- Cola, Eli-Lilly, Goldman Sachs and Morgah Stanley.
How to Improve EVA:
Some of the steps which help to improve EVA are given below:
(i) Invest in projects that earn more than the cost of capital. A slow and steady approach in the direction will ensure growth.
(ii) Make better utilization of resources to improve productivity and profitability.
(iii) Eliminate less profitable business units that generate operating profits less than the cost of capital.
(iv) Motivate management and employees by linking incentive pay with EVA.
Benefits of EVA – (As Seen by Godrej):
Management:
(i) Improvements in capital efficiency.
(ii) Greater focus on tax optimisation.
(iii) Greater focus on optimal capital structure.
(iv) Improved strategic and scenario planning.
(v) More robust acquisition analysis tools.
Motivation:
(i) Long -term focus.
(ii) Greater alignment between shareholder and employee interests.
Limitations of EVA:
(i) A flat rate of total cost of capital may not be appropriate as it does not consider the ‘rate advantage’ enjoyed by an enterprise, by raising cheap funds.
(ii) EVA does not consider the appreciation in the price of fixed assets. Some enterprises may be strategically happy with the asset price appreciation than the regular operating income made through business operations.
(iii) EVA does not give a correct, specific computation of the net real growth in the owner’s wealth. This is because total cost of capital at a blanket rate also includes cost of owner’s fund.
(iv) A positive EVA indicates Value addition to the enterprise’s capital. This net positive addition is not a bench marked addition. The fundamental question of rate of such absolute growth is not answered by the EVA. Thus, EVA is not a very good measurement of appreciation in shareholders’ wealth.
b. Market Value Added (MVA):
Market Value Added measures the stock market’s estimate of the net present value of a company’s past and expected capital investment projects. It should be differentiated from Shareholder Value and EVA. Shareholder Value is the present value of the anticipated future streams of cash flow from the business plus the value of a company if it is liquidated. EVA is value added to the shareholders by generating operating profit in excess of cost of capital employed in business.
It is residual income after charging the cost of capital provided by shareholders and lenders. Several companies mention the EVA in their annual reports to show the extent to which they have been able to create shareholder value. Companies line ONGC, Hindustan Lever, BSNL, Bajaj Auto and Bharat Petroleum have scored high on EVA. But TISCO, L&T, Essar Steel, Indo Rama performed poorly on EVA.
MVA is the difference between the current market value of the company and the capital employed by it. Suppose the market value of the Co. (the sum of the market value of equity and debt) is Rs.1,00,000 and its economic book value of capital is 80,000 then MVA will be 20,000. MVA can be +ve or -vc.

Where C is weighted average Cost of capital.
Relationship between in MVA and EVA:
MVA is simply the present value of all the future EVAs.